Ghanaian vs Soviet Union 8th Grade
COMPARE
Ghanaian
Soviet Union
8th Grade
8th Grade Comparison
Ghanaians
Soviet Union
94.9%
8TH GRADE
0.6/ 100
METRIC RATING
259th/ 347
METRIC RANK
96.1%
8TH GRADE
92.6/ 100
METRIC RATING
130th/ 347
METRIC RANK
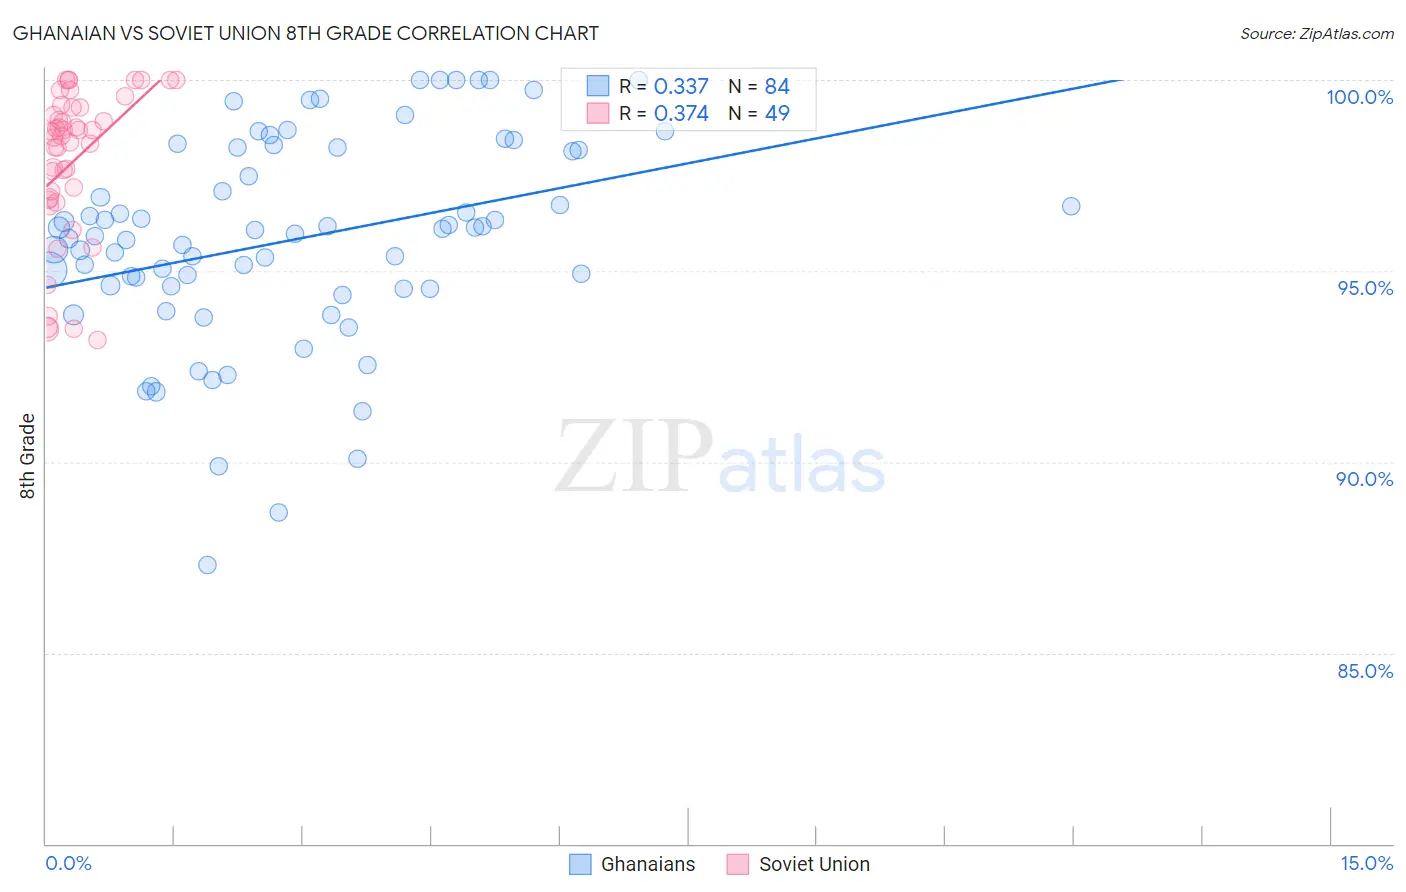
Ghanaian vs Soviet Union 8th Grade Correlation Chart
The statistical analysis conducted on geographies consisting of 190,712,873 people shows a mild positive correlation between the proportion of Ghanaians and percentage of population with at least 8th grade education in the United States with a correlation coefficient (R) of 0.337 and weighted average of 94.9%. Similarly, the statistical analysis conducted on geographies consisting of 43,454,395 people shows a mild positive correlation between the proportion of Soviet Union and percentage of population with at least 8th grade education in the United States with a correlation coefficient (R) of 0.374 and weighted average of 96.1%, a difference of 1.3%.
8th Grade Correlation Summary
| Measurement | Ghanaian | Soviet Union |
| Minimum | 87.3% | 93.2% |
| Maximum | 100.0% | 100.0% |
| Range | 12.7% | 6.8% |
| Mean | 95.8% | 97.9% |
| Median | 96.0% | 98.5% |
| Interquartile 25% (IQ1) | 94.6% | 96.9% |
| Interquartile 75% (IQ3) | 98.2% | 99.3% |
| Interquartile Range (IQR) | 3.6% | 2.4% |
| Standard Deviation (Sample) | 2.7% | 2.0% |
| Standard Deviation (Population) | 2.7% | 1.9% |
Similar Demographics by 8th Grade
Demographics Similar to Ghanaians by 8th Grade
In terms of 8th grade, the demographic groups most similar to Ghanaians are Immigrants from Congo (94.9%, a difference of 0.0%), Immigrants from Jamaica (94.9%, a difference of 0.0%), Afghan (94.9%, a difference of 0.010%), Colombian (95.0%, a difference of 0.020%), and Immigrants from Somalia (95.0%, a difference of 0.030%).
| Demographics | Rating | Rank | 8th Grade |
| Immigrants | Ethiopia | 1.0 /100 | #252 | Tragic 95.0% |
| U.S. Virgin Islanders | 0.9 /100 | #253 | Tragic 95.0% |
| Immigrants | Cameroon | 0.8 /100 | #254 | Tragic 95.0% |
| Immigrants | Somalia | 0.7 /100 | #255 | Tragic 95.0% |
| Colombians | 0.7 /100 | #256 | Tragic 95.0% |
| Afghans | 0.6 /100 | #257 | Tragic 94.9% |
| Immigrants | Congo | 0.6 /100 | #258 | Tragic 94.9% |
| Ghanaians | 0.6 /100 | #259 | Tragic 94.9% |
| Immigrants | Jamaica | 0.6 /100 | #260 | Tragic 94.9% |
| Immigrants | Costa Rica | 0.5 /100 | #261 | Tragic 94.9% |
| Immigrants | Nigeria | 0.4 /100 | #262 | Tragic 94.9% |
| Immigrants | Hong Kong | 0.4 /100 | #263 | Tragic 94.9% |
| South Americans | 0.4 /100 | #264 | Tragic 94.9% |
| Yuman | 0.4 /100 | #265 | Tragic 94.9% |
| West Indians | 0.3 /100 | #266 | Tragic 94.8% |
Demographics Similar to Soviet Union by 8th Grade
In terms of 8th grade, the demographic groups most similar to Soviet Union are Pueblo (96.1%, a difference of 0.010%), Immigrants from Kuwait (96.1%, a difference of 0.010%), Cheyenne (96.1%, a difference of 0.020%), Immigrants from Turkey (96.1%, a difference of 0.020%), and Immigrants from Hungary (96.1%, a difference of 0.020%).
| Demographics | Rating | Rank | 8th Grade |
| Filipinos | 94.6 /100 | #123 | Exceptional 96.2% |
| Palestinians | 94.6 /100 | #124 | Exceptional 96.2% |
| Immigrants | Romania | 94.1 /100 | #125 | Exceptional 96.2% |
| Choctaw | 94.0 /100 | #126 | Exceptional 96.2% |
| Immigrants | Serbia | 94.0 /100 | #127 | Exceptional 96.2% |
| Immigrants | Bosnia and Herzegovina | 93.9 /100 | #128 | Exceptional 96.2% |
| Cheyenne | 93.3 /100 | #129 | Exceptional 96.1% |
| Soviet Union | 92.6 /100 | #130 | Exceptional 96.1% |
| Pueblo | 92.3 /100 | #131 | Exceptional 96.1% |
| Immigrants | Kuwait | 92.2 /100 | #132 | Exceptional 96.1% |
| Immigrants | Turkey | 91.7 /100 | #133 | Exceptional 96.1% |
| Immigrants | Hungary | 91.5 /100 | #134 | Exceptional 96.1% |
| Basques | 91.5 /100 | #135 | Exceptional 96.1% |
| Jordanians | 91.3 /100 | #136 | Exceptional 96.1% |
| Cambodians | 90.6 /100 | #137 | Exceptional 96.1% |