Ghanaian vs Soviet Union Male Unemployment
COMPARE
Ghanaian
Soviet Union
Male Unemployment
Male Unemployment Comparison
Ghanaians
Soviet Union
6.1%
MALE UNEMPLOYMENT
0.0/ 100
METRIC RATING
279th/ 347
METRIC RANK
5.6%
MALE UNEMPLOYMENT
3.2/ 100
METRIC RATING
221st/ 347
METRIC RANK
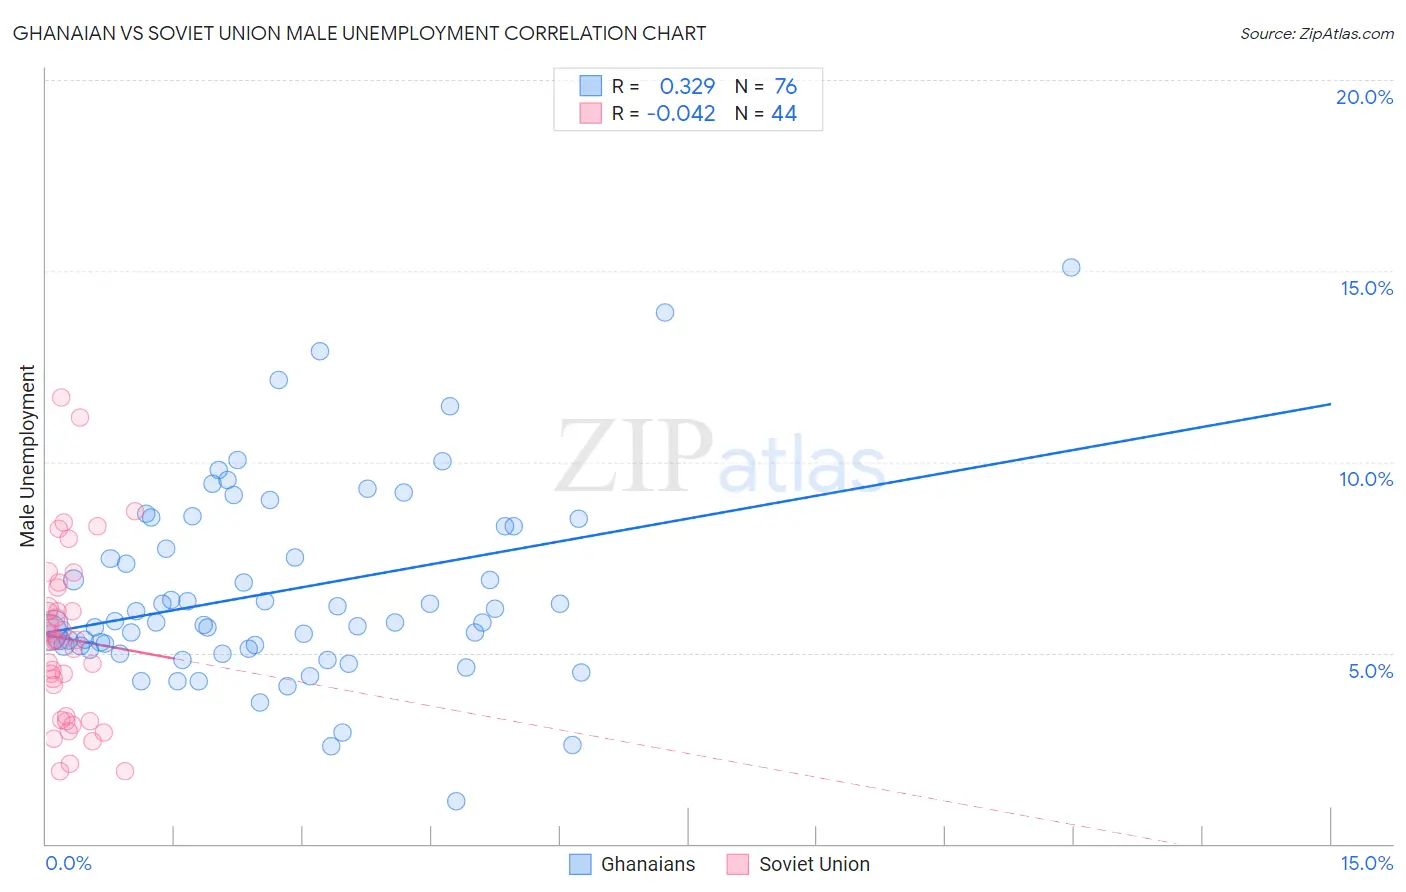
Ghanaian vs Soviet Union Male Unemployment Correlation Chart
The statistical analysis conducted on geographies consisting of 190,397,000 people shows a mild positive correlation between the proportion of Ghanaians and unemployment rate among males in the United States with a correlation coefficient (R) of 0.329 and weighted average of 6.1%. Similarly, the statistical analysis conducted on geographies consisting of 43,494,943 people shows no correlation between the proportion of Soviet Union and unemployment rate among males in the United States with a correlation coefficient (R) of -0.042 and weighted average of 5.6%, a difference of 9.6%.
Male Unemployment Correlation Summary
| Measurement | Ghanaian | Soviet Union |
| Minimum | 1.1% | 1.9% |
| Maximum | 15.1% | 11.7% |
| Range | 14.0% | 9.8% |
| Mean | 6.6% | 5.4% |
| Median | 5.8% | 5.3% |
| Interquartile 25% (IQ1) | 5.1% | 3.3% |
| Interquartile 75% (IQ3) | 8.3% | 6.4% |
| Interquartile Range (IQR) | 3.2% | 3.1% |
| Standard Deviation (Sample) | 2.6% | 2.3% |
| Standard Deviation (Population) | 2.5% | 2.2% |
Similar Demographics by Male Unemployment
Demographics Similar to Ghanaians by Male Unemployment
In terms of male unemployment, the demographic groups most similar to Ghanaians are Immigrants from Fiji (6.1%, a difference of 0.50%), Immigrants from Liberia (6.1%, a difference of 0.62%), Immigrants from Ghana (6.2%, a difference of 0.99%), Tlingit-Haida (6.0%, a difference of 1.1%), and Sierra Leonean (6.2%, a difference of 1.1%).
| Demographics | Rating | Rank | Male Unemployment |
| Immigrants | Uzbekistan | 0.0 /100 | #272 | Tragic 6.0% |
| Armenians | 0.0 /100 | #273 | Tragic 6.0% |
| Immigrants | Sierra Leone | 0.0 /100 | #274 | Tragic 6.0% |
| Menominee | 0.0 /100 | #275 | Tragic 6.0% |
| Tlingit-Haida | 0.0 /100 | #276 | Tragic 6.0% |
| Immigrants | Liberia | 0.0 /100 | #277 | Tragic 6.1% |
| Immigrants | Fiji | 0.0 /100 | #278 | Tragic 6.1% |
| Ghanaians | 0.0 /100 | #279 | Tragic 6.1% |
| Immigrants | Ghana | 0.0 /100 | #280 | Tragic 6.2% |
| Sierra Leoneans | 0.0 /100 | #281 | Tragic 6.2% |
| Ecuadorians | 0.0 /100 | #282 | Tragic 6.2% |
| Immigrants | Western Africa | 0.0 /100 | #283 | Tragic 6.2% |
| Spanish American Indians | 0.0 /100 | #284 | Tragic 6.2% |
| Immigrants | Ecuador | 0.0 /100 | #285 | Tragic 6.2% |
| Africans | 0.0 /100 | #286 | Tragic 6.3% |
Demographics Similar to Soviet Union by Male Unemployment
In terms of male unemployment, the demographic groups most similar to Soviet Union are Portuguese (5.6%, a difference of 0.11%), Immigrants from Western Asia (5.6%, a difference of 0.13%), Immigrants from Micronesia (5.6%, a difference of 0.14%), Immigrants from Albania (5.5%, a difference of 0.18%), and Creek (5.6%, a difference of 0.29%).
| Demographics | Rating | Rank | Male Unemployment |
| Puget Sound Salish | 5.6 /100 | #214 | Tragic 5.5% |
| Samoans | 4.9 /100 | #215 | Tragic 5.5% |
| Immigrants | Immigrants | 4.3 /100 | #216 | Tragic 5.5% |
| Delaware | 4.2 /100 | #217 | Tragic 5.5% |
| Immigrants | Albania | 3.6 /100 | #218 | Tragic 5.5% |
| Immigrants | Western Asia | 3.5 /100 | #219 | Tragic 5.6% |
| Portuguese | 3.5 /100 | #220 | Tragic 5.6% |
| Soviet Union | 3.2 /100 | #221 | Tragic 5.6% |
| Immigrants | Micronesia | 2.9 /100 | #222 | Tragic 5.6% |
| Creek | 2.6 /100 | #223 | Tragic 5.6% |
| Cherokee | 2.4 /100 | #224 | Tragic 5.6% |
| Panamanians | 1.9 /100 | #225 | Tragic 5.6% |
| Immigrants | Cambodia | 1.8 /100 | #226 | Tragic 5.6% |
| Immigrants | Panama | 1.8 /100 | #227 | Tragic 5.6% |
| Seminole | 1.8 /100 | #228 | Tragic 5.6% |