Ghanaian vs Black/African American Per Capita Income
COMPARE
Ghanaian
Black/African American
Per Capita Income
Per Capita Income Comparison
Ghanaians
Blacks/African Americans
$42,164
PER CAPITA INCOME
15.7/ 100
METRIC RATING
206th/ 347
METRIC RANK
$35,564
PER CAPITA INCOME
0.0/ 100
METRIC RATING
321st/ 347
METRIC RANK
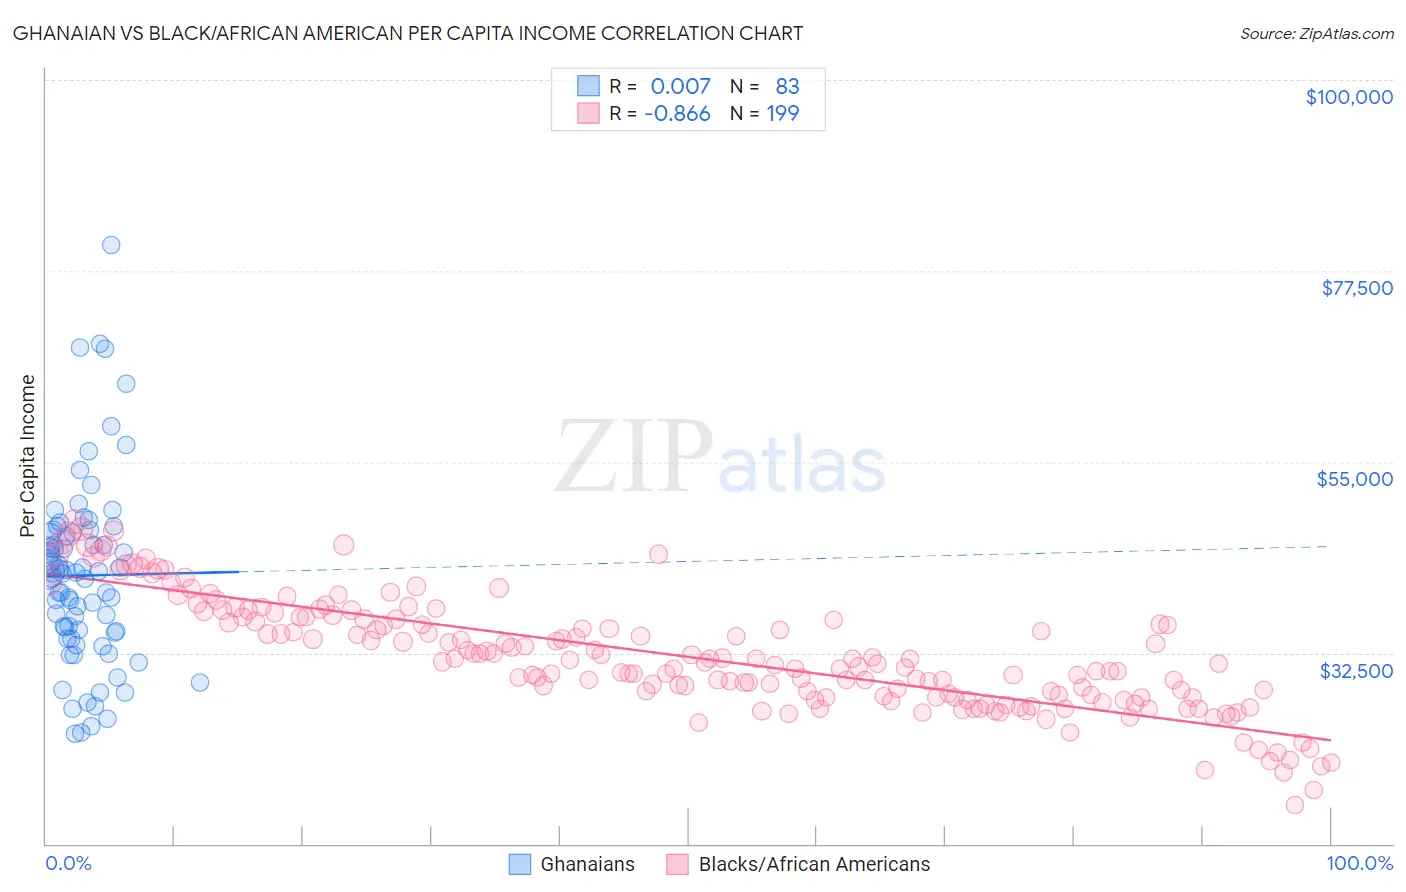
Ghanaian vs Black/African American Per Capita Income Correlation Chart
The statistical analysis conducted on geographies consisting of 190,723,780 people shows no correlation between the proportion of Ghanaians and per capita income in the United States with a correlation coefficient (R) of 0.007 and weighted average of $42,164. Similarly, the statistical analysis conducted on geographies consisting of 564,923,865 people shows a very strong negative correlation between the proportion of Blacks/African Americans and per capita income in the United States with a correlation coefficient (R) of -0.866 and weighted average of $35,564, a difference of 18.6%.
Per Capita Income Correlation Summary
| Measurement | Ghanaian | Black/African American |
| Minimum | $22,951 | $14,598 |
| Maximum | $80,537 | $47,964 |
| Range | $57,586 | $33,366 |
| Mean | $41,613 | $32,008 |
| Median | $41,877 | $31,154 |
| Interquartile 25% (IQ1) | $34,906 | $27,216 |
| Interquartile 75% (IQ3) | $46,657 | $36,450 |
| Interquartile Range (IQR) | $11,751 | $9,234 |
| Standard Deviation (Sample) | $10,874 | $6,581 |
| Standard Deviation (Population) | $10,809 | $6,564 |
Similar Demographics by Per Capita Income
Demographics Similar to Ghanaians by Per Capita Income
In terms of per capita income, the demographic groups most similar to Ghanaians are White/Caucasian ($42,180, a difference of 0.040%), Aleut ($42,210, a difference of 0.11%), Spanish ($42,249, a difference of 0.20%), Venezuelan ($42,074, a difference of 0.21%), and Immigrants from Bosnia and Herzegovina ($42,278, a difference of 0.27%).
| Demographics | Rating | Rank | Per Capita Income |
| Barbadians | 19.6 /100 | #199 | Poor $42,406 |
| Vietnamese | 19.0 /100 | #200 | Poor $42,368 |
| Immigrants | Thailand | 17.6 /100 | #201 | Poor $42,289 |
| Immigrants | Bosnia and Herzegovina | 17.5 /100 | #202 | Poor $42,278 |
| Spanish | 17.0 /100 | #203 | Poor $42,249 |
| Aleuts | 16.4 /100 | #204 | Poor $42,210 |
| Whites/Caucasians | 15.9 /100 | #205 | Poor $42,180 |
| Ghanaians | 15.7 /100 | #206 | Poor $42,164 |
| Venezuelans | 14.4 /100 | #207 | Poor $42,074 |
| Panamanians | 13.9 /100 | #208 | Poor $42,035 |
| Immigrants | Sudan | 13.2 /100 | #209 | Poor $41,986 |
| Ecuadorians | 12.9 /100 | #210 | Poor $41,958 |
| Immigrants | Panama | 11.6 /100 | #211 | Poor $41,853 |
| Immigrants | Senegal | 11.3 /100 | #212 | Poor $41,830 |
| Immigrants | Venezuela | 10.2 /100 | #213 | Poor $41,727 |
Demographics Similar to Blacks/African Americans by Per Capita Income
In terms of per capita income, the demographic groups most similar to Blacks/African Americans are Creek ($35,546, a difference of 0.050%), Hispanic or Latino ($35,688, a difference of 0.35%), Immigrants from Congo ($35,720, a difference of 0.44%), Cheyenne ($35,276, a difference of 0.82%), and Bangladeshi ($35,897, a difference of 0.94%).
| Demographics | Rating | Rank | Per Capita Income |
| Seminole | 0.0 /100 | #314 | Tragic $36,180 |
| Yaqui | 0.0 /100 | #315 | Tragic $36,112 |
| Choctaw | 0.0 /100 | #316 | Tragic $35,999 |
| Dutch West Indians | 0.0 /100 | #317 | Tragic $35,922 |
| Bangladeshis | 0.0 /100 | #318 | Tragic $35,897 |
| Immigrants | Congo | 0.0 /100 | #319 | Tragic $35,720 |
| Hispanics or Latinos | 0.0 /100 | #320 | Tragic $35,688 |
| Blacks/African Americans | 0.0 /100 | #321 | Tragic $35,564 |
| Creek | 0.0 /100 | #322 | Tragic $35,546 |
| Cheyenne | 0.0 /100 | #323 | Tragic $35,276 |
| Kiowa | 0.0 /100 | #324 | Tragic $35,102 |
| Immigrants | Central America | 0.0 /100 | #325 | Tragic $34,974 |
| Immigrants | Cuba | 0.0 /100 | #326 | Tragic $34,910 |
| Apache | 0.0 /100 | #327 | Tragic $34,886 |
| Menominee | 0.0 /100 | #328 | Tragic $34,578 |