Kenyan vs Soviet Union Per Capita Income
COMPARE
Kenyan
Soviet Union
Per Capita Income
Per Capita Income Comparison
Kenyans
Soviet Union
$42,808
PER CAPITA INCOME
27.7/ 100
METRIC RATING
190th/ 347
METRIC RANK
$54,202
PER CAPITA INCOME
100.0/ 100
METRIC RATING
20th/ 347
METRIC RANK
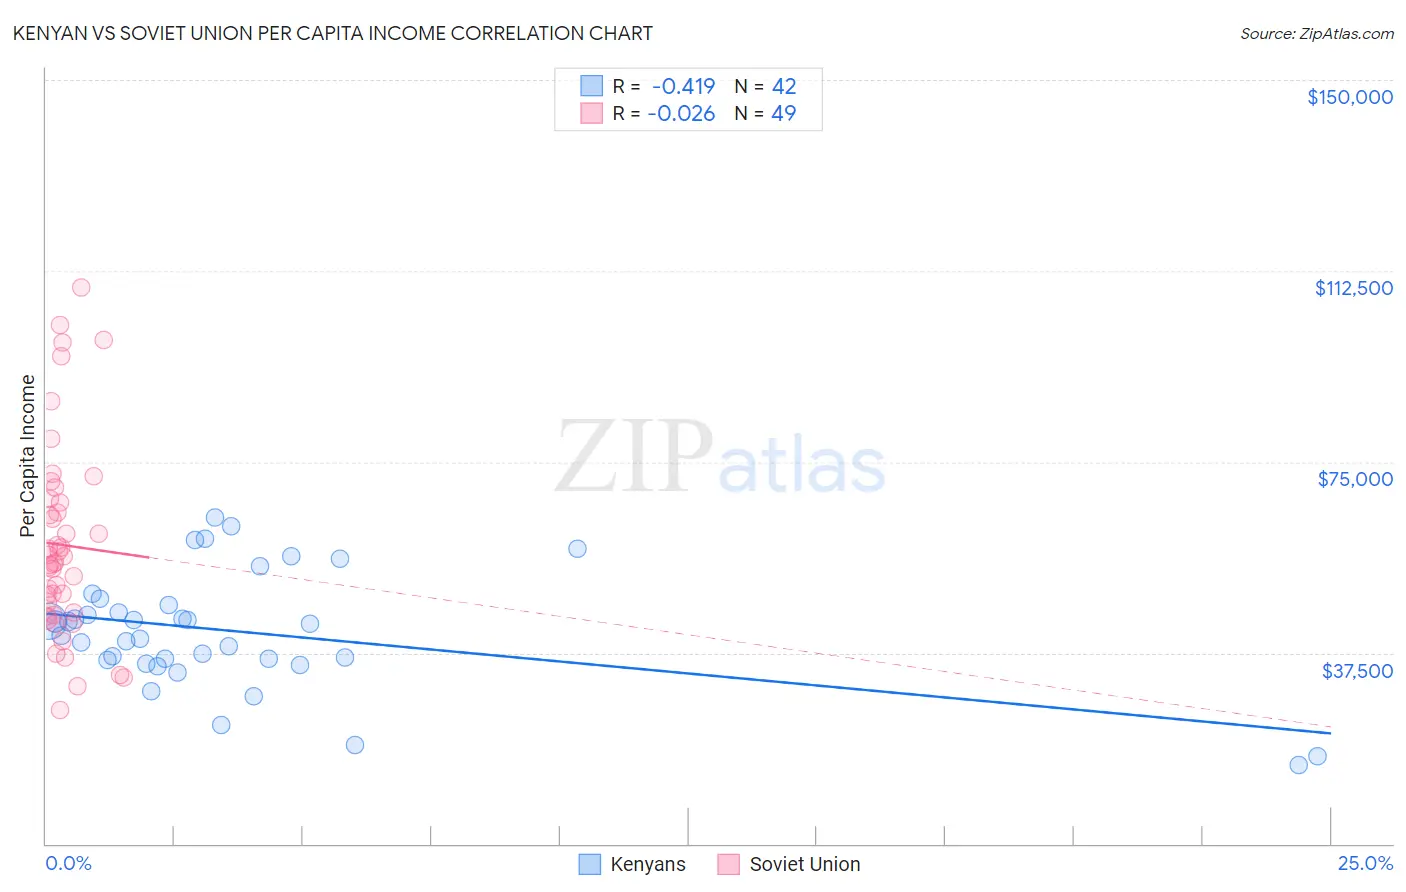
Kenyan vs Soviet Union Per Capita Income Correlation Chart
The statistical analysis conducted on geographies consisting of 168,245,574 people shows a moderate negative correlation between the proportion of Kenyans and per capita income in the United States with a correlation coefficient (R) of -0.419 and weighted average of $42,808. Similarly, the statistical analysis conducted on geographies consisting of 43,511,973 people shows no correlation between the proportion of Soviet Union and per capita income in the United States with a correlation coefficient (R) of -0.026 and weighted average of $54,202, a difference of 26.6%.
Per Capita Income Correlation Summary
| Measurement | Kenyan | Soviet Union |
| Minimum | $15,366 | $26,314 |
| Maximum | $64,188 | $109,367 |
| Range | $48,822 | $83,053 |
| Mean | $41,624 | $58,669 |
| Median | $42,003 | $55,152 |
| Interquartile 25% (IQ1) | $36,158 | $45,115 |
| Interquartile 75% (IQ3) | $46,865 | $67,421 |
| Interquartile Range (IQR) | $10,707 | $22,306 |
| Standard Deviation (Sample) | $11,486 | $19,133 |
| Standard Deviation (Population) | $11,348 | $18,936 |
Similar Demographics by Per Capita Income
Demographics Similar to Kenyans by Per Capita Income
In terms of per capita income, the demographic groups most similar to Kenyans are Yugoslavian ($42,792, a difference of 0.040%), Iraqi ($42,760, a difference of 0.11%), Immigrants from Sierra Leone ($42,752, a difference of 0.13%), Bermudan ($42,911, a difference of 0.24%), and Immigrants from Fiji ($42,694, a difference of 0.27%).
| Demographics | Rating | Rank | Per Capita Income |
| Germans | 33.9 /100 | #183 | Fair $43,067 |
| Spaniards | 32.9 /100 | #184 | Fair $43,028 |
| Immigrants | Immigrants | 32.5 /100 | #185 | Fair $43,010 |
| French Canadians | 32.3 /100 | #186 | Fair $43,003 |
| Immigrants | Colombia | 31.5 /100 | #187 | Fair $42,971 |
| Immigrants | Africa | 31.0 /100 | #188 | Fair $42,950 |
| Bermudans | 30.1 /100 | #189 | Fair $42,911 |
| Kenyans | 27.7 /100 | #190 | Fair $42,808 |
| Yugoslavians | 27.4 /100 | #191 | Fair $42,792 |
| Iraqis | 26.7 /100 | #192 | Fair $42,760 |
| Immigrants | Sierra Leone | 26.5 /100 | #193 | Fair $42,752 |
| Immigrants | Fiji | 25.2 /100 | #194 | Fair $42,694 |
| Immigrants | Kenya | 24.5 /100 | #195 | Fair $42,661 |
| Dutch | 23.4 /100 | #196 | Fair $42,605 |
| Scotch-Irish | 22.6 /100 | #197 | Fair $42,563 |
Demographics Similar to Soviet Union by Per Capita Income
In terms of per capita income, the demographic groups most similar to Soviet Union are Immigrants from Northern Europe ($54,159, a difference of 0.080%), Immigrants from China ($54,264, a difference of 0.11%), Thai ($54,307, a difference of 0.19%), Indian (Asian) ($53,874, a difference of 0.61%), and Immigrants from France ($54,557, a difference of 0.65%).
| Demographics | Rating | Rank | Per Capita Income |
| Immigrants | India | 100.0 /100 | #13 | Exceptional $55,268 |
| Immigrants | Belgium | 100.0 /100 | #14 | Exceptional $55,082 |
| Cypriots | 100.0 /100 | #15 | Exceptional $54,899 |
| Immigrants | Switzerland | 100.0 /100 | #16 | Exceptional $54,866 |
| Immigrants | France | 100.0 /100 | #17 | Exceptional $54,557 |
| Thais | 100.0 /100 | #18 | Exceptional $54,307 |
| Immigrants | China | 100.0 /100 | #19 | Exceptional $54,264 |
| Soviet Union | 100.0 /100 | #20 | Exceptional $54,202 |
| Immigrants | Northern Europe | 100.0 /100 | #21 | Exceptional $54,159 |
| Indians (Asian) | 100.0 /100 | #22 | Exceptional $53,874 |
| Immigrants | Eastern Asia | 100.0 /100 | #23 | Exceptional $53,806 |
| Immigrants | Denmark | 100.0 /100 | #24 | Exceptional $53,799 |
| Immigrants | Japan | 100.0 /100 | #25 | Exceptional $53,359 |
| Russians | 100.0 /100 | #26 | Exceptional $53,154 |
| Immigrants | South Central Asia | 100.0 /100 | #27 | Exceptional $52,660 |