German Russian vs Slavic Wage/Income Gap
COMPARE
German Russian
Slavic
Wage/Income Gap
Wage/Income Gap Comparison
German Russians
Slavs
24.6%
WAGE/INCOME GAP
93.7/ 100
METRIC RATING
127th/ 347
METRIC RANK
27.4%
WAGE/INCOME GAP
1.8/ 100
METRIC RATING
258th/ 347
METRIC RANK
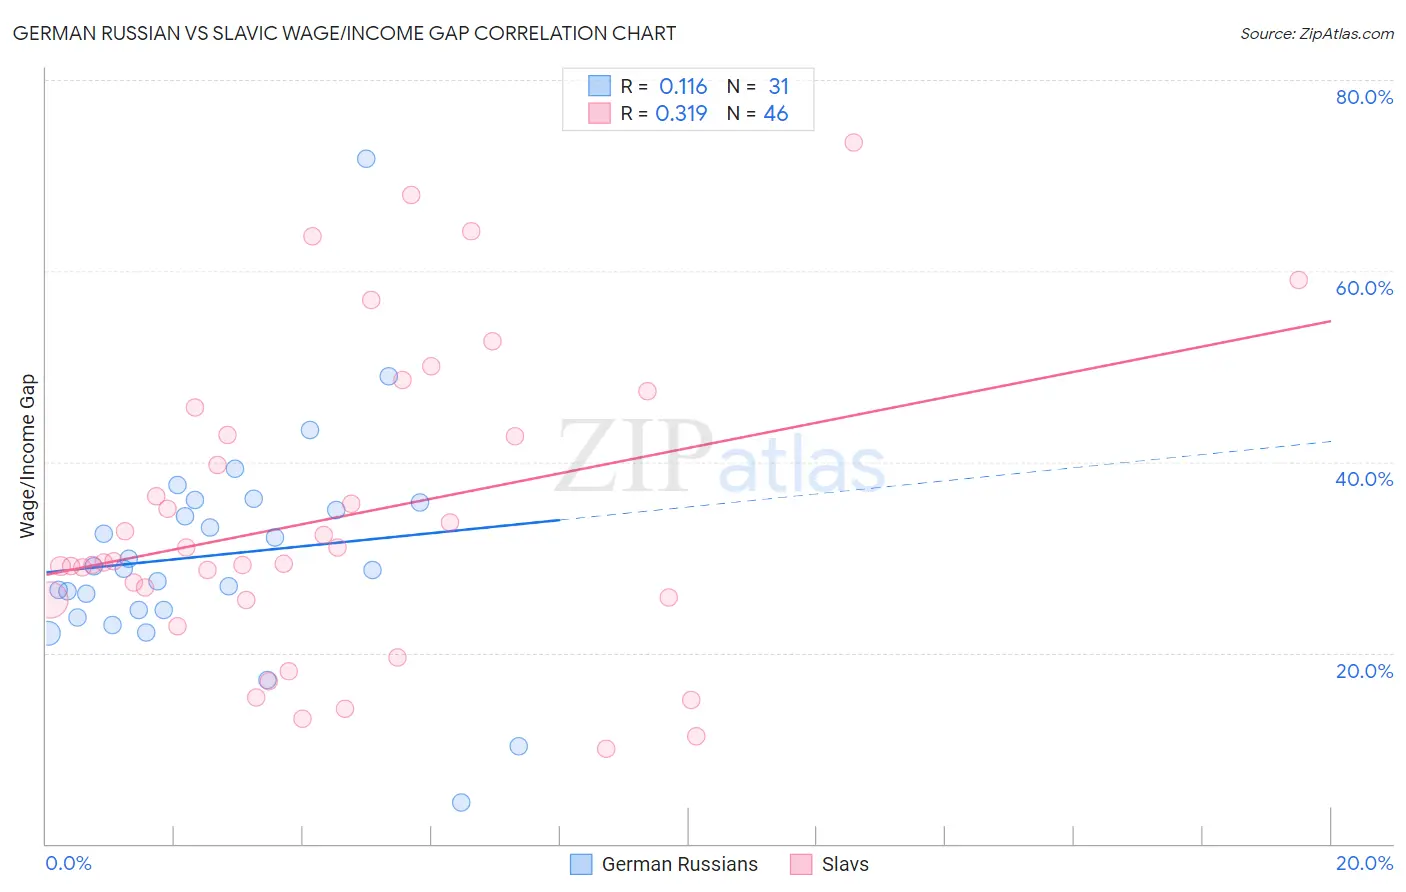
German Russian vs Slavic Wage/Income Gap Correlation Chart
The statistical analysis conducted on geographies consisting of 96,446,629 people shows a poor positive correlation between the proportion of German Russians and wage/income gap percentage in the United States with a correlation coefficient (R) of 0.116 and weighted average of 24.6%. Similarly, the statistical analysis conducted on geographies consisting of 270,754,650 people shows a mild positive correlation between the proportion of Slavs and wage/income gap percentage in the United States with a correlation coefficient (R) of 0.319 and weighted average of 27.4%, a difference of 11.4%.
Wage/Income Gap Correlation Summary
| Measurement | German Russian | Slavic |
| Minimum | 4.3% | 10.0% |
| Maximum | 71.8% | 73.5% |
| Range | 67.5% | 63.5% |
| Mean | 30.2% | 34.2% |
| Median | 28.8% | 29.5% |
| Interquartile 25% (IQ1) | 24.4% | 25.6% |
| Interquartile 75% (IQ3) | 35.8% | 42.9% |
| Interquartile Range (IQR) | 11.3% | 17.3% |
| Standard Deviation (Sample) | 11.8% | 15.7% |
| Standard Deviation (Population) | 11.6% | 15.5% |
Similar Demographics by Wage/Income Gap
Demographics Similar to German Russians by Wage/Income Gap
In terms of wage/income gap, the demographic groups most similar to German Russians are Immigrants from Uruguay (24.6%, a difference of 0.010%), Spanish American (24.6%, a difference of 0.020%), Immigrants from South America (24.6%, a difference of 0.050%), Immigrants from Central America (24.6%, a difference of 0.070%), and Yup'ik (24.7%, a difference of 0.12%).
| Demographics | Rating | Rank | Wage/Income Gap |
| Cree | 95.6 /100 | #120 | Exceptional 24.5% |
| Immigrants | Thailand | 94.9 /100 | #121 | Exceptional 24.5% |
| Apache | 94.8 /100 | #122 | Exceptional 24.5% |
| Natives/Alaskans | 94.6 /100 | #123 | Exceptional 24.6% |
| Immigrants | South America | 93.9 /100 | #124 | Exceptional 24.6% |
| Spanish Americans | 93.8 /100 | #125 | Exceptional 24.6% |
| Immigrants | Uruguay | 93.8 /100 | #126 | Exceptional 24.6% |
| German Russians | 93.7 /100 | #127 | Exceptional 24.6% |
| Immigrants | Central America | 93.5 /100 | #128 | Exceptional 24.6% |
| Yup'ik | 93.3 /100 | #129 | Exceptional 24.7% |
| Alsatians | 93.2 /100 | #130 | Exceptional 24.7% |
| Immigrants | Philippines | 93.0 /100 | #131 | Exceptional 24.7% |
| Immigrants | Costa Rica | 92.4 /100 | #132 | Exceptional 24.7% |
| Colombians | 92.4 /100 | #133 | Exceptional 24.7% |
| Mexican American Indians | 92.2 /100 | #134 | Exceptional 24.7% |
Demographics Similar to Slavs by Wage/Income Gap
In terms of wage/income gap, the demographic groups most similar to Slavs are Luxembourger (27.4%, a difference of 0.040%), Icelander (27.5%, a difference of 0.080%), Cherokee (27.4%, a difference of 0.090%), Tongan (27.5%, a difference of 0.090%), and Immigrants from France (27.4%, a difference of 0.19%).
| Demographics | Rating | Rank | Wage/Income Gap |
| Immigrants | Norway | 2.5 /100 | #251 | Tragic 27.3% |
| Ukrainians | 2.4 /100 | #252 | Tragic 27.3% |
| Portuguese | 2.2 /100 | #253 | Tragic 27.4% |
| Israelis | 2.1 /100 | #254 | Tragic 27.4% |
| Immigrants | France | 2.1 /100 | #255 | Tragic 27.4% |
| Cherokee | 1.9 /100 | #256 | Tragic 27.4% |
| Luxembourgers | 1.9 /100 | #257 | Tragic 27.4% |
| Slavs | 1.8 /100 | #258 | Tragic 27.4% |
| Icelanders | 1.8 /100 | #259 | Tragic 27.5% |
| Tongans | 1.7 /100 | #260 | Tragic 27.5% |
| Immigrants | Germany | 1.5 /100 | #261 | Tragic 27.5% |
| Immigrants | Lebanon | 1.5 /100 | #262 | Tragic 27.5% |
| Syrians | 1.4 /100 | #263 | Tragic 27.6% |
| Immigrants | Switzerland | 1.0 /100 | #264 | Tragic 27.7% |
| Serbians | 1.0 /100 | #265 | Tragic 27.7% |