Finnish vs Immigrants from Germany Median Male Earnings
COMPARE
Finnish
Immigrants from Germany
Median Male Earnings
Median Male Earnings Comparison
Finns
Immigrants from Germany
$54,721
MEDIAN MALE EARNINGS
55.6/ 100
METRIC RATING
170th/ 347
METRIC RANK
$56,542
MEDIAN MALE EARNINGS
88.2/ 100
METRIC RATING
133rd/ 347
METRIC RANK
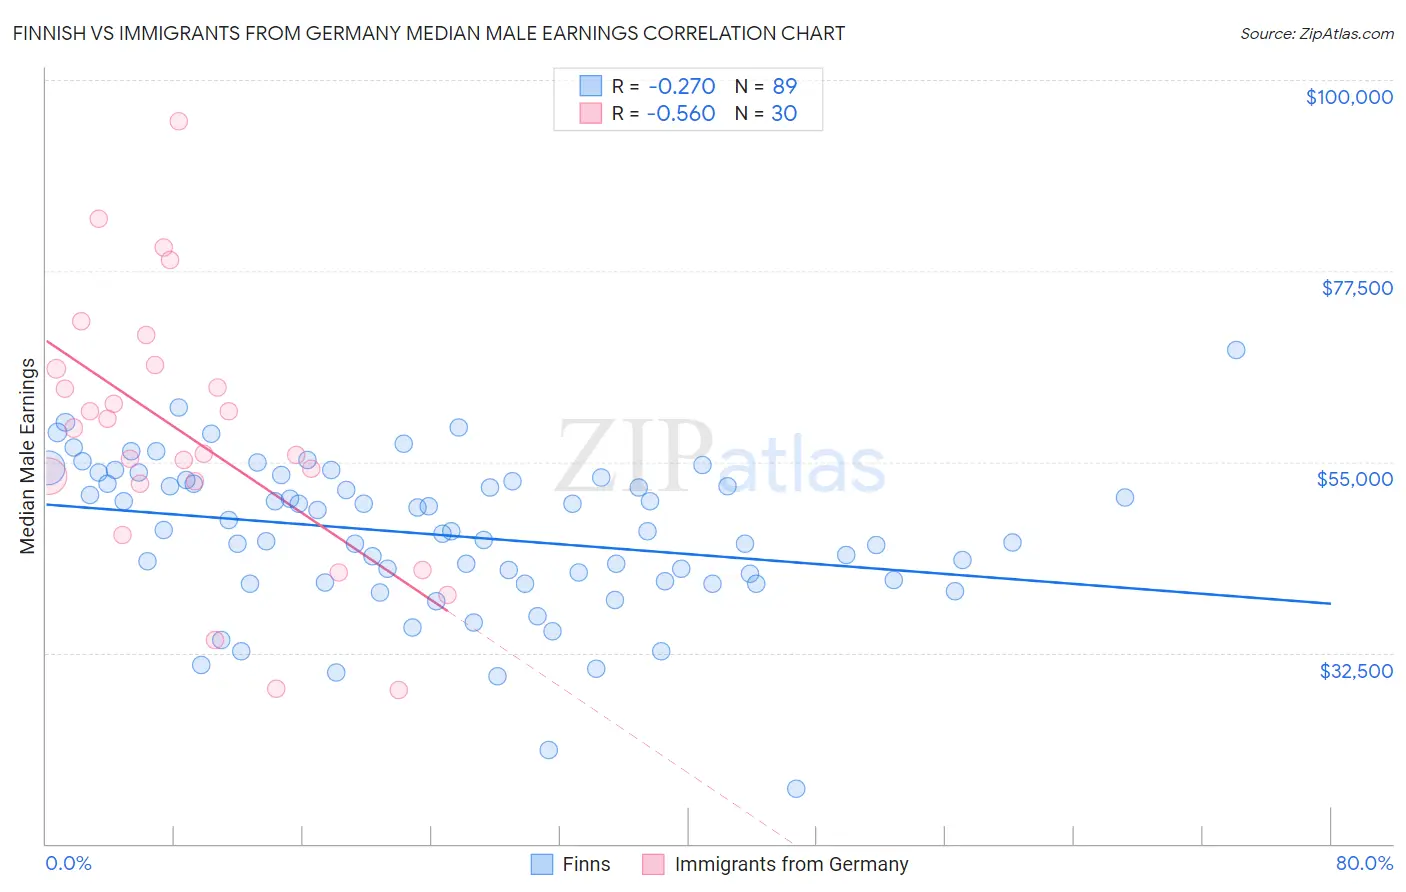
Finnish vs Immigrants from Germany Median Male Earnings Correlation Chart
The statistical analysis conducted on geographies consisting of 404,473,332 people shows a weak negative correlation between the proportion of Finns and median male earnings in the United States with a correlation coefficient (R) of -0.270 and weighted average of $54,721. Similarly, the statistical analysis conducted on geographies consisting of 463,604,477 people shows a substantial negative correlation between the proportion of Immigrants from Germany and median male earnings in the United States with a correlation coefficient (R) of -0.560 and weighted average of $56,542, a difference of 3.3%.
Median Male Earnings Correlation Summary
| Measurement | Finnish | Immigrants from Germany |
| Minimum | $16,413 | $28,125 |
| Maximum | $68,250 | $95,140 |
| Range | $51,837 | $67,015 |
| Mean | $46,398 | $57,924 |
| Median | $46,792 | $57,493 |
| Interquartile 25% (IQ1) | $40,892 | $52,399 |
| Interquartile 75% (IQ3) | $52,786 | $65,976 |
| Interquartile Range (IQR) | $11,894 | $13,576 |
| Standard Deviation (Sample) | $8,951 | $15,513 |
| Standard Deviation (Population) | $8,900 | $15,253 |
Similar Demographics by Median Male Earnings
Demographics Similar to Finns by Median Male Earnings
In terms of median male earnings, the demographic groups most similar to Finns are French Canadian ($54,722, a difference of 0.0%), Immigrants from Peru ($54,695, a difference of 0.050%), Welsh ($54,647, a difference of 0.14%), Immigrants from Vietnam ($54,913, a difference of 0.35%), and South American Indian ($54,508, a difference of 0.39%).
| Demographics | Rating | Rank | Median Male Earnings |
| Ugandans | 68.6 /100 | #163 | Good $55,290 |
| Immigrants | South Eastern Asia | 67.6 /100 | #164 | Good $55,241 |
| Immigrants | Portugal | 66.3 /100 | #165 | Good $55,182 |
| Germans | 61.6 /100 | #166 | Good $54,974 |
| Immigrants | Fiji | 61.2 /100 | #167 | Good $54,958 |
| Immigrants | Vietnam | 60.2 /100 | #168 | Good $54,913 |
| French Canadians | 55.6 /100 | #169 | Average $54,722 |
| Finns | 55.6 /100 | #170 | Average $54,721 |
| Immigrants | Peru | 54.9 /100 | #171 | Average $54,695 |
| Welsh | 53.8 /100 | #172 | Average $54,647 |
| South American Indians | 50.4 /100 | #173 | Average $54,508 |
| South Americans | 50.0 /100 | #174 | Average $54,492 |
| Dutch | 48.0 /100 | #175 | Average $54,410 |
| Spaniards | 47.8 /100 | #176 | Average $54,401 |
| Costa Ricans | 44.8 /100 | #177 | Average $54,279 |
Demographics Similar to Immigrants from Germany by Median Male Earnings
In terms of median male earnings, the demographic groups most similar to Immigrants from Germany are Czech ($56,546, a difference of 0.010%), Moroccan ($56,499, a difference of 0.080%), Irish ($56,464, a difference of 0.14%), Immigrants from Saudi Arabia ($56,452, a difference of 0.16%), and Portuguese ($56,663, a difference of 0.21%).
| Demographics | Rating | Rank | Median Male Earnings |
| Chinese | 91.1 /100 | #126 | Exceptional $56,872 |
| Brazilians | 90.9 /100 | #127 | Exceptional $56,837 |
| Immigrants | Syria | 90.8 /100 | #128 | Exceptional $56,830 |
| Pakistanis | 89.9 /100 | #129 | Excellent $56,719 |
| Koreans | 89.4 /100 | #130 | Excellent $56,672 |
| Portuguese | 89.4 /100 | #131 | Excellent $56,663 |
| Czechs | 88.2 /100 | #132 | Excellent $56,546 |
| Immigrants | Germany | 88.2 /100 | #133 | Excellent $56,542 |
| Moroccans | 87.7 /100 | #134 | Excellent $56,499 |
| Irish | 87.4 /100 | #135 | Excellent $56,464 |
| Immigrants | Saudi Arabia | 87.2 /100 | #136 | Excellent $56,452 |
| Slavs | 86.5 /100 | #137 | Excellent $56,390 |
| Slovaks | 85.5 /100 | #138 | Excellent $56,306 |
| Zimbabweans | 85.5 /100 | #139 | Excellent $56,302 |
| Luxembourgers | 85.5 /100 | #140 | Excellent $56,300 |