Finnish vs Immigrants from Germany Single Mother Poverty
COMPARE
Finnish
Immigrants from Germany
Single Mother Poverty
Single Mother Poverty Comparison
Finns
Immigrants from Germany
30.0%
SINGLE MOTHER POVERTY
9.3/ 100
METRIC RATING
219th/ 347
METRIC RANK
29.5%
SINGLE MOTHER POVERTY
30.4/ 100
METRIC RATING
190th/ 347
METRIC RANK
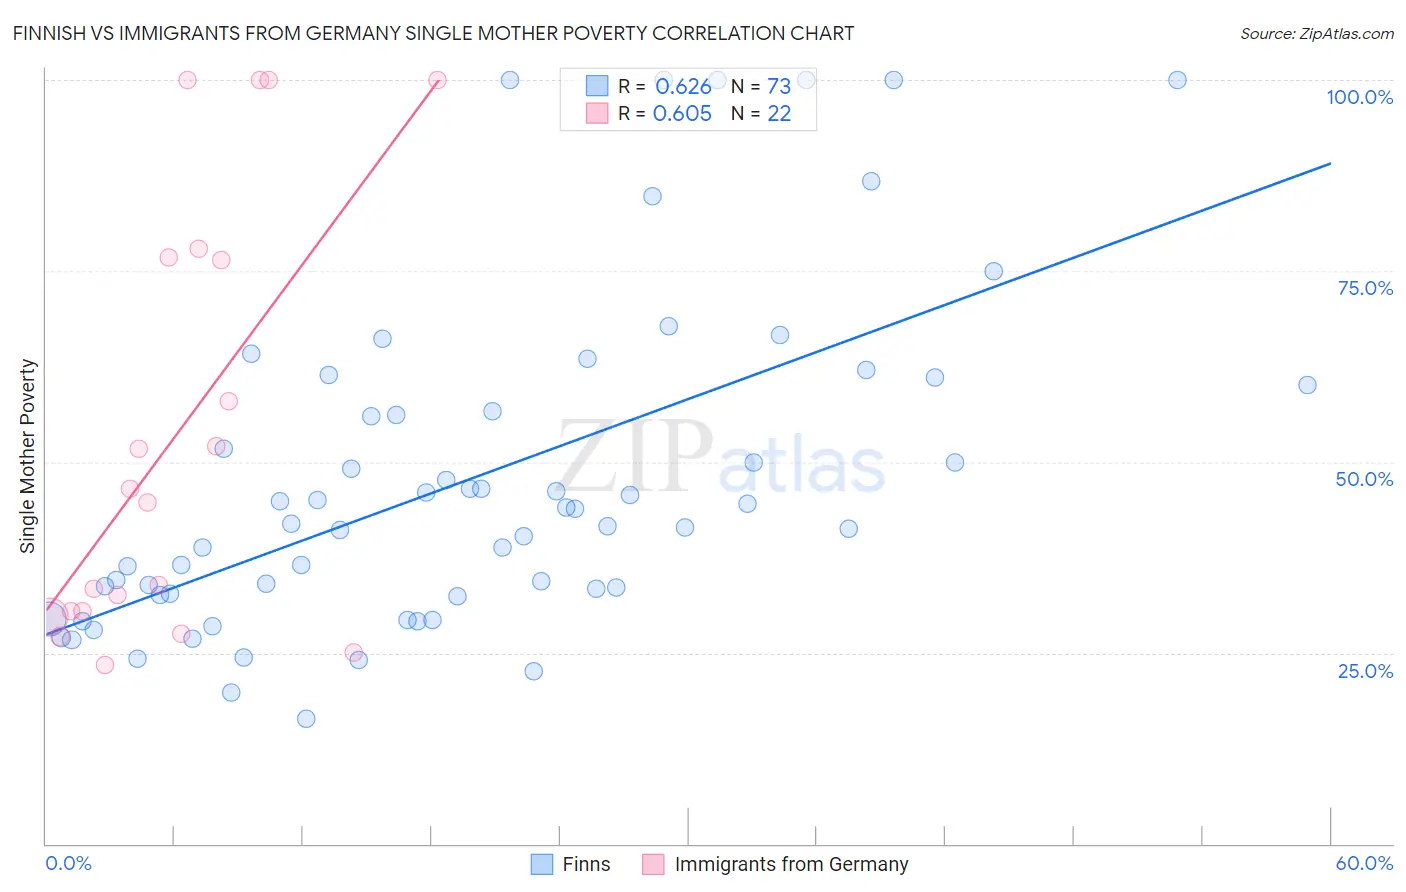
Finnish vs Immigrants from Germany Single Mother Poverty Correlation Chart
The statistical analysis conducted on geographies consisting of 392,432,308 people shows a significant positive correlation between the proportion of Finns and poverty level among single mothers in the United States with a correlation coefficient (R) of 0.626 and weighted average of 30.0%. Similarly, the statistical analysis conducted on geographies consisting of 449,496,540 people shows a significant positive correlation between the proportion of Immigrants from Germany and poverty level among single mothers in the United States with a correlation coefficient (R) of 0.605 and weighted average of 29.5%, a difference of 1.7%.
Single Mother Poverty Correlation Summary
| Measurement | Finnish | Immigrants from Germany |
| Minimum | 16.4% | 23.4% |
| Maximum | 100.0% | 100.0% |
| Range | 83.6% | 76.6% |
| Mean | 47.6% | 53.5% |
| Median | 42.0% | 45.6% |
| Interquartile 25% (IQ1) | 32.7% | 30.4% |
| Interquartile 75% (IQ3) | 58.3% | 76.8% |
| Interquartile Range (IQR) | 25.6% | 46.4% |
| Standard Deviation (Sample) | 21.5% | 28.0% |
| Standard Deviation (Population) | 21.4% | 27.3% |
Similar Demographics by Single Mother Poverty
Demographics Similar to Finns by Single Mother Poverty
In terms of single mother poverty, the demographic groups most similar to Finns are German (30.0%, a difference of 0.070%), Hungarian (29.9%, a difference of 0.14%), Immigrants from Ghana (29.9%, a difference of 0.25%), Immigrants from Eritrea (30.0%, a difference of 0.25%), and Sudanese (30.0%, a difference of 0.25%).
| Demographics | Rating | Rank | Single Mother Poverty |
| Nicaraguans | 12.4 /100 | #212 | Poor 29.8% |
| Immigrants | Thailand | 12.0 /100 | #213 | Poor 29.9% |
| Liberians | 11.7 /100 | #214 | Poor 29.9% |
| Jamaicans | 11.7 /100 | #215 | Poor 29.9% |
| Immigrants | Western Africa | 11.5 /100 | #216 | Poor 29.9% |
| Immigrants | Ghana | 11.3 /100 | #217 | Poor 29.9% |
| Hungarians | 10.3 /100 | #218 | Poor 29.9% |
| Finns | 9.3 /100 | #219 | Tragic 30.0% |
| Germans | 8.8 /100 | #220 | Tragic 30.0% |
| Immigrants | Eritrea | 7.7 /100 | #221 | Tragic 30.0% |
| Sudanese | 7.6 /100 | #222 | Tragic 30.0% |
| Immigrants | Cuba | 6.9 /100 | #223 | Tragic 30.1% |
| Immigrants | Sudan | 6.5 /100 | #224 | Tragic 30.1% |
| Spanish | 6.3 /100 | #225 | Tragic 30.1% |
| Scottish | 6.0 /100 | #226 | Tragic 30.1% |
Demographics Similar to Immigrants from Germany by Single Mother Poverty
In terms of single mother poverty, the demographic groups most similar to Immigrants from Germany are Guamanian/Chamorro (29.4%, a difference of 0.070%), Immigrants from Africa (29.4%, a difference of 0.070%), Immigrants from Trinidad and Tobago (29.5%, a difference of 0.070%), Moroccan (29.5%, a difference of 0.10%), and Lebanese (29.4%, a difference of 0.11%).
| Demographics | Rating | Rank | Single Mother Poverty |
| Nepalese | 38.3 /100 | #183 | Fair 29.3% |
| Nigerians | 38.0 /100 | #184 | Fair 29.3% |
| Ghanaians | 36.8 /100 | #185 | Fair 29.4% |
| Yugoslavians | 36.0 /100 | #186 | Fair 29.4% |
| Lebanese | 32.5 /100 | #187 | Fair 29.4% |
| Guamanians/Chamorros | 31.8 /100 | #188 | Fair 29.4% |
| Immigrants | Africa | 31.6 /100 | #189 | Fair 29.4% |
| Immigrants | Germany | 30.4 /100 | #190 | Fair 29.5% |
| Immigrants | Trinidad and Tobago | 29.2 /100 | #191 | Fair 29.5% |
| Moroccans | 28.6 /100 | #192 | Fair 29.5% |
| Basques | 28.3 /100 | #193 | Fair 29.5% |
| Icelanders | 26.1 /100 | #194 | Fair 29.5% |
| Slavs | 24.5 /100 | #195 | Fair 29.6% |
| Spanish American Indians | 23.4 /100 | #196 | Fair 29.6% |
| Immigrants | Jamaica | 22.0 /100 | #197 | Fair 29.6% |