Finnish vs Immigrants from South Africa Median Male Earnings
COMPARE
Finnish
Immigrants from South Africa
Median Male Earnings
Median Male Earnings Comparison
Finns
Immigrants from South Africa
$54,721
MEDIAN MALE EARNINGS
55.6/ 100
METRIC RATING
170th/ 347
METRIC RANK
$62,899
MEDIAN MALE EARNINGS
100.0/ 100
METRIC RATING
39th/ 347
METRIC RANK
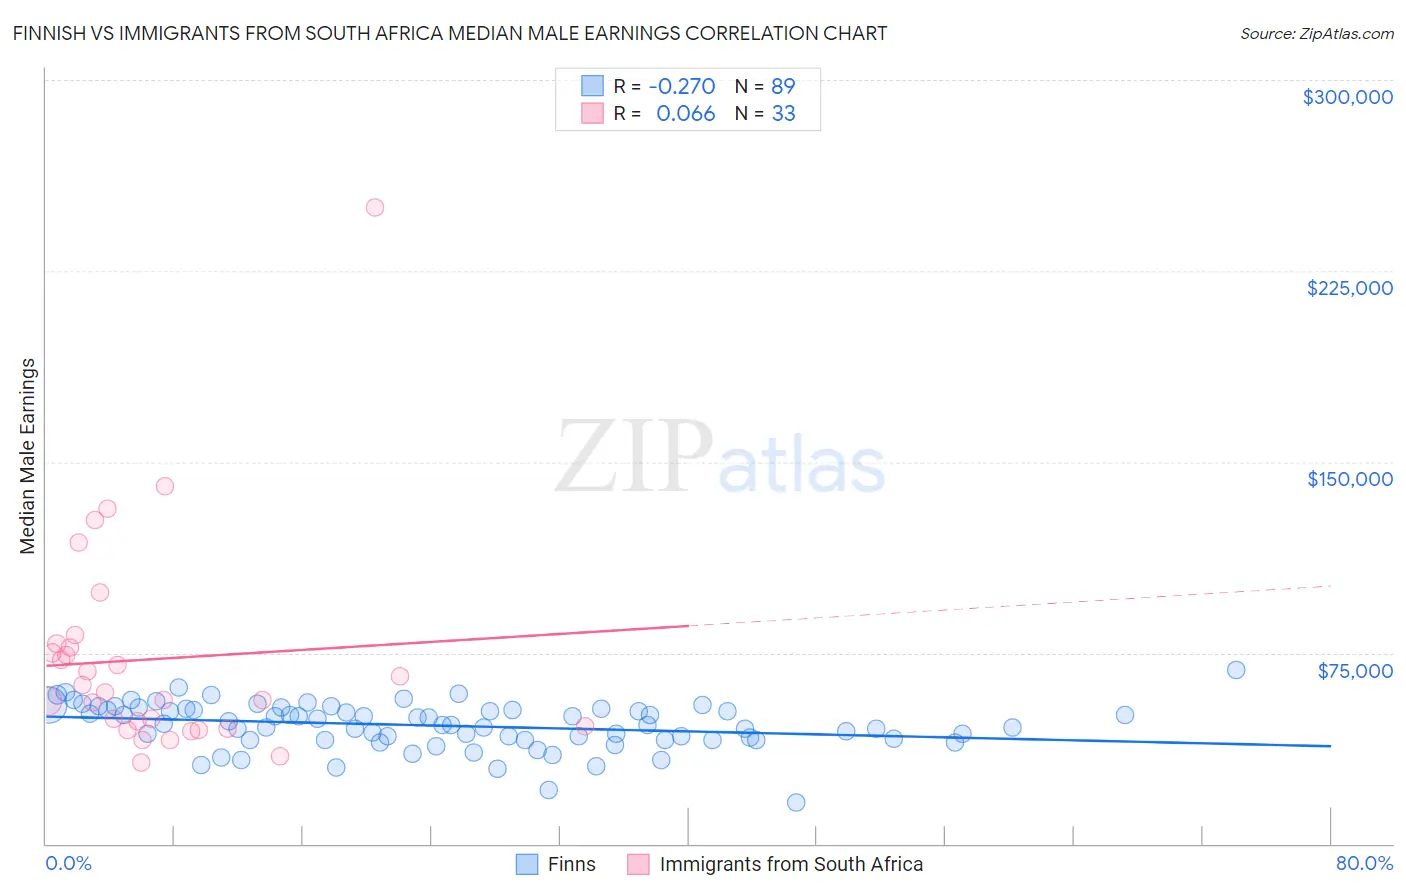
Finnish vs Immigrants from South Africa Median Male Earnings Correlation Chart
The statistical analysis conducted on geographies consisting of 404,473,332 people shows a weak negative correlation between the proportion of Finns and median male earnings in the United States with a correlation coefficient (R) of -0.270 and weighted average of $54,721. Similarly, the statistical analysis conducted on geographies consisting of 233,272,809 people shows a slight positive correlation between the proportion of Immigrants from South Africa and median male earnings in the United States with a correlation coefficient (R) of 0.066 and weighted average of $62,899, a difference of 14.9%.
Median Male Earnings Correlation Summary
| Measurement | Finnish | Immigrants from South Africa |
| Minimum | $16,413 | $31,875 |
| Maximum | $68,250 | $250,001 |
| Range | $51,837 | $218,126 |
| Mean | $46,398 | $72,583 |
| Median | $46,792 | $59,605 |
| Interquartile 25% (IQ1) | $40,892 | $45,646 |
| Interquartile 75% (IQ3) | $52,786 | $77,820 |
| Interquartile Range (IQR) | $11,894 | $32,174 |
| Standard Deviation (Sample) | $8,951 | $42,392 |
| Standard Deviation (Population) | $8,900 | $41,745 |
Similar Demographics by Median Male Earnings
Demographics Similar to Finns by Median Male Earnings
In terms of median male earnings, the demographic groups most similar to Finns are French Canadian ($54,722, a difference of 0.0%), Immigrants from Peru ($54,695, a difference of 0.050%), Welsh ($54,647, a difference of 0.14%), Immigrants from Vietnam ($54,913, a difference of 0.35%), and South American Indian ($54,508, a difference of 0.39%).
| Demographics | Rating | Rank | Median Male Earnings |
| Ugandans | 68.6 /100 | #163 | Good $55,290 |
| Immigrants | South Eastern Asia | 67.6 /100 | #164 | Good $55,241 |
| Immigrants | Portugal | 66.3 /100 | #165 | Good $55,182 |
| Germans | 61.6 /100 | #166 | Good $54,974 |
| Immigrants | Fiji | 61.2 /100 | #167 | Good $54,958 |
| Immigrants | Vietnam | 60.2 /100 | #168 | Good $54,913 |
| French Canadians | 55.6 /100 | #169 | Average $54,722 |
| Finns | 55.6 /100 | #170 | Average $54,721 |
| Immigrants | Peru | 54.9 /100 | #171 | Average $54,695 |
| Welsh | 53.8 /100 | #172 | Average $54,647 |
| South American Indians | 50.4 /100 | #173 | Average $54,508 |
| South Americans | 50.0 /100 | #174 | Average $54,492 |
| Dutch | 48.0 /100 | #175 | Average $54,410 |
| Spaniards | 47.8 /100 | #176 | Average $54,401 |
| Costa Ricans | 44.8 /100 | #177 | Average $54,279 |
Demographics Similar to Immigrants from South Africa by Median Male Earnings
In terms of median male earnings, the demographic groups most similar to Immigrants from South Africa are Australian ($62,857, a difference of 0.070%), Maltese ($62,953, a difference of 0.090%), Immigrants from Turkey ($62,728, a difference of 0.27%), Immigrants from Sri Lanka ($63,099, a difference of 0.32%), and Immigrants from Greece ($62,689, a difference of 0.34%).
| Demographics | Rating | Rank | Median Male Earnings |
| Soviet Union | 100.0 /100 | #32 | Exceptional $63,382 |
| Immigrants | Lithuania | 100.0 /100 | #33 | Exceptional $63,346 |
| Immigrants | Russia | 100.0 /100 | #34 | Exceptional $63,326 |
| Immigrants | Asia | 100.0 /100 | #35 | Exceptional $63,240 |
| Israelis | 100.0 /100 | #36 | Exceptional $63,228 |
| Immigrants | Sri Lanka | 100.0 /100 | #37 | Exceptional $63,099 |
| Maltese | 100.0 /100 | #38 | Exceptional $62,953 |
| Immigrants | South Africa | 100.0 /100 | #39 | Exceptional $62,899 |
| Australians | 100.0 /100 | #40 | Exceptional $62,857 |
| Immigrants | Turkey | 100.0 /100 | #41 | Exceptional $62,728 |
| Immigrants | Greece | 100.0 /100 | #42 | Exceptional $62,689 |
| Immigrants | Belarus | 100.0 /100 | #43 | Exceptional $62,658 |
| Cambodians | 100.0 /100 | #44 | Exceptional $62,516 |
| Bulgarians | 100.0 /100 | #45 | Exceptional $62,378 |
| Immigrants | Czechoslovakia | 99.9 /100 | #46 | Exceptional $62,217 |