Finnish vs Apache Median Male Earnings
COMPARE
Finnish
Apache
Median Male Earnings
Median Male Earnings Comparison
Finns
Apache
$54,721
MEDIAN MALE EARNINGS
55.6/ 100
METRIC RATING
170th/ 347
METRIC RANK
$46,429
MEDIAN MALE EARNINGS
0.0/ 100
METRIC RATING
311th/ 347
METRIC RANK
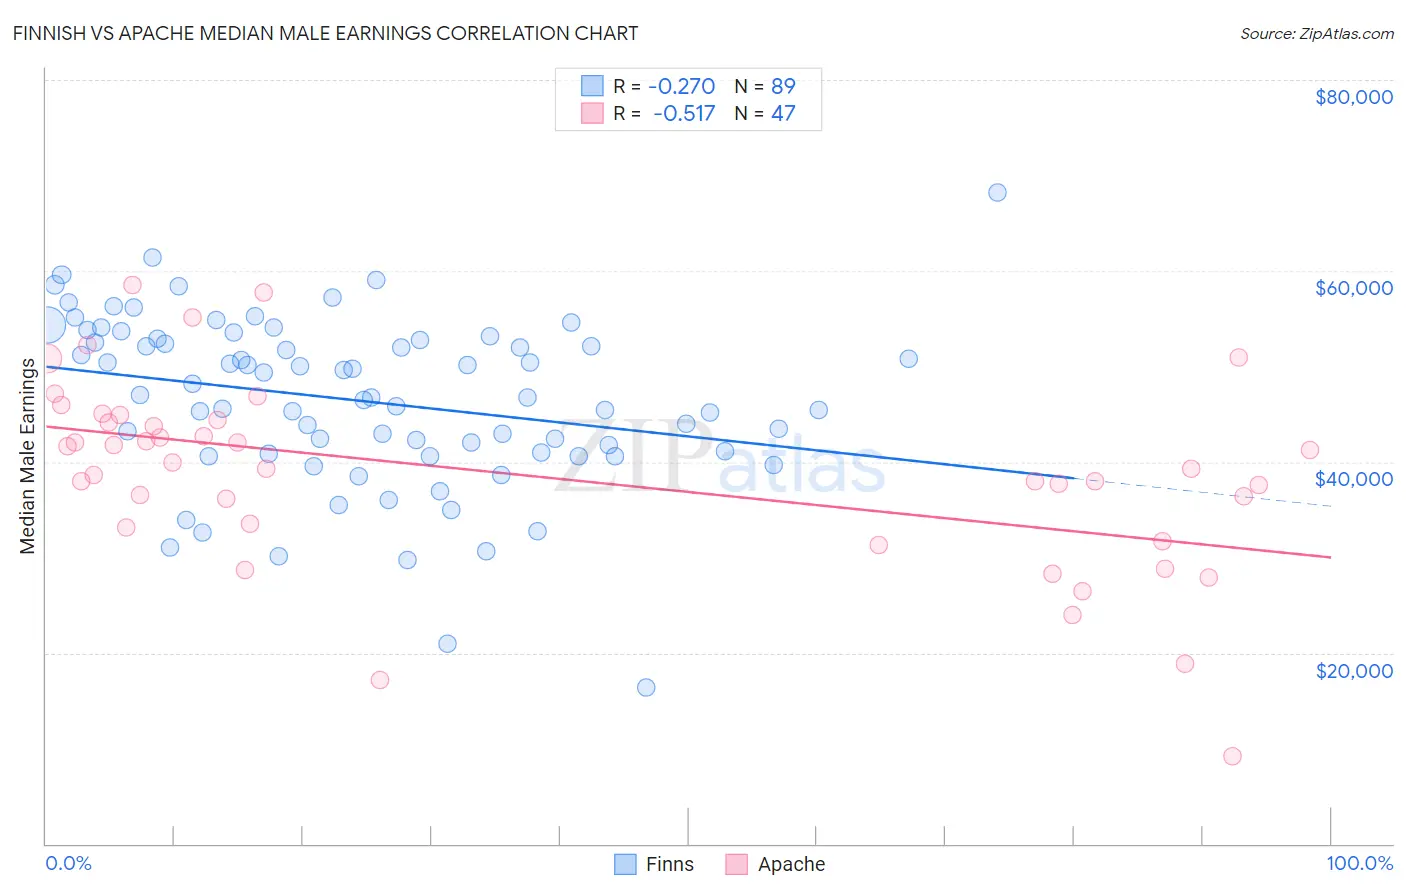
Finnish vs Apache Median Male Earnings Correlation Chart
The statistical analysis conducted on geographies consisting of 404,473,332 people shows a weak negative correlation between the proportion of Finns and median male earnings in the United States with a correlation coefficient (R) of -0.270 and weighted average of $54,721. Similarly, the statistical analysis conducted on geographies consisting of 231,058,501 people shows a substantial negative correlation between the proportion of Apache and median male earnings in the United States with a correlation coefficient (R) of -0.517 and weighted average of $46,429, a difference of 17.9%.
Median Male Earnings Correlation Summary
| Measurement | Finnish | Apache |
| Minimum | $16,413 | $9,161 |
| Maximum | $68,250 | $58,566 |
| Range | $51,837 | $49,405 |
| Mean | $46,398 | $38,686 |
| Median | $46,792 | $39,318 |
| Interquartile 25% (IQ1) | $40,892 | $33,190 |
| Interquartile 75% (IQ3) | $52,786 | $44,375 |
| Interquartile Range (IQR) | $11,894 | $11,185 |
| Standard Deviation (Sample) | $8,951 | $10,062 |
| Standard Deviation (Population) | $8,900 | $9,955 |
Similar Demographics by Median Male Earnings
Demographics Similar to Finns by Median Male Earnings
In terms of median male earnings, the demographic groups most similar to Finns are French Canadian ($54,722, a difference of 0.0%), Immigrants from Peru ($54,695, a difference of 0.050%), Welsh ($54,647, a difference of 0.14%), Immigrants from Vietnam ($54,913, a difference of 0.35%), and South American Indian ($54,508, a difference of 0.39%).
| Demographics | Rating | Rank | Median Male Earnings |
| Ugandans | 68.6 /100 | #163 | Good $55,290 |
| Immigrants | South Eastern Asia | 67.6 /100 | #164 | Good $55,241 |
| Immigrants | Portugal | 66.3 /100 | #165 | Good $55,182 |
| Germans | 61.6 /100 | #166 | Good $54,974 |
| Immigrants | Fiji | 61.2 /100 | #167 | Good $54,958 |
| Immigrants | Vietnam | 60.2 /100 | #168 | Good $54,913 |
| French Canadians | 55.6 /100 | #169 | Average $54,722 |
| Finns | 55.6 /100 | #170 | Average $54,721 |
| Immigrants | Peru | 54.9 /100 | #171 | Average $54,695 |
| Welsh | 53.8 /100 | #172 | Average $54,647 |
| South American Indians | 50.4 /100 | #173 | Average $54,508 |
| South Americans | 50.0 /100 | #174 | Average $54,492 |
| Dutch | 48.0 /100 | #175 | Average $54,410 |
| Spaniards | 47.8 /100 | #176 | Average $54,401 |
| Costa Ricans | 44.8 /100 | #177 | Average $54,279 |
Demographics Similar to Apache by Median Male Earnings
In terms of median male earnings, the demographic groups most similar to Apache are Hispanic or Latino ($46,419, a difference of 0.020%), Honduran ($46,374, a difference of 0.12%), Chippewa ($46,368, a difference of 0.13%), Cuban ($46,580, a difference of 0.33%), and Creek ($46,594, a difference of 0.36%).
| Demographics | Rating | Rank | Median Male Earnings |
| Bangladeshis | 0.1 /100 | #304 | Tragic $46,744 |
| Guatemalans | 0.0 /100 | #305 | Tragic $46,736 |
| Dutch West Indians | 0.0 /100 | #306 | Tragic $46,656 |
| Immigrants | Dominican Republic | 0.0 /100 | #307 | Tragic $46,655 |
| Ottawa | 0.0 /100 | #308 | Tragic $46,611 |
| Creek | 0.0 /100 | #309 | Tragic $46,594 |
| Cubans | 0.0 /100 | #310 | Tragic $46,580 |
| Apache | 0.0 /100 | #311 | Tragic $46,429 |
| Hispanics or Latinos | 0.0 /100 | #312 | Tragic $46,419 |
| Hondurans | 0.0 /100 | #313 | Tragic $46,374 |
| Chippewa | 0.0 /100 | #314 | Tragic $46,368 |
| Immigrants | Guatemala | 0.0 /100 | #315 | Tragic $46,244 |
| Immigrants | Caribbean | 0.0 /100 | #316 | Tragic $46,193 |
| Mexicans | 0.0 /100 | #317 | Tragic $46,147 |
| Cheyenne | 0.0 /100 | #318 | Tragic $46,062 |