Finnish vs Kenyan Median Male Earnings
COMPARE
Finnish
Kenyan
Median Male Earnings
Median Male Earnings Comparison
Finns
Kenyans
$54,721
MEDIAN MALE EARNINGS
55.6/ 100
METRIC RATING
170th/ 347
METRIC RANK
$53,647
MEDIAN MALE EARNINGS
30.4/ 100
METRIC RATING
193rd/ 347
METRIC RANK
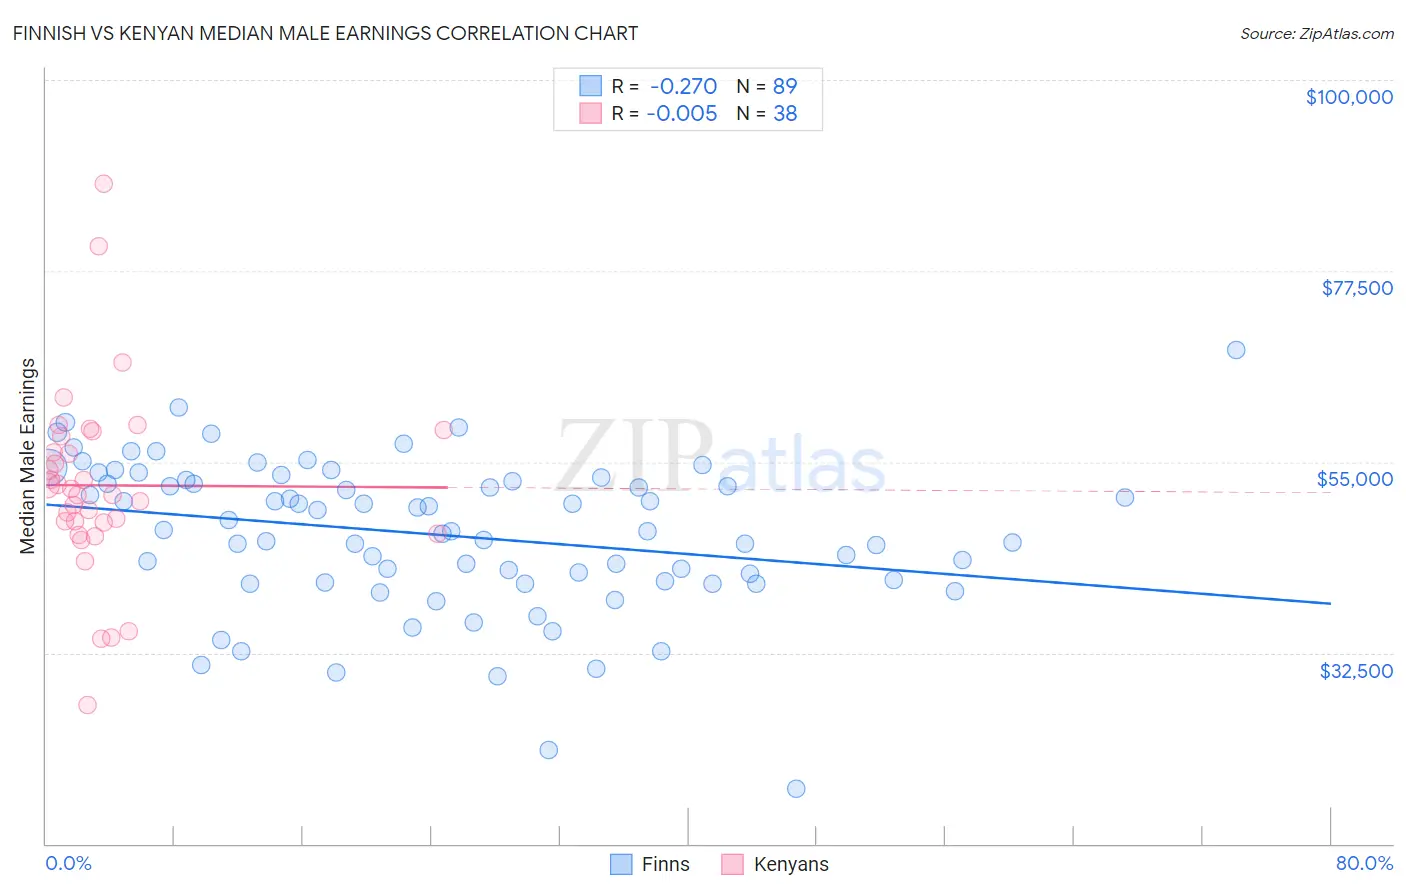
Finnish vs Kenyan Median Male Earnings Correlation Chart
The statistical analysis conducted on geographies consisting of 404,473,332 people shows a weak negative correlation between the proportion of Finns and median male earnings in the United States with a correlation coefficient (R) of -0.270 and weighted average of $54,721. Similarly, the statistical analysis conducted on geographies consisting of 168,231,087 people shows no correlation between the proportion of Kenyans and median male earnings in the United States with a correlation coefficient (R) of -0.005 and weighted average of $53,647, a difference of 2.0%.
Median Male Earnings Correlation Summary
| Measurement | Finnish | Kenyan |
| Minimum | $16,413 | $26,389 |
| Maximum | $68,250 | $87,784 |
| Range | $51,837 | $61,395 |
| Mean | $46,398 | $52,229 |
| Median | $46,792 | $51,523 |
| Interquartile 25% (IQ1) | $40,892 | $47,893 |
| Interquartile 75% (IQ3) | $52,786 | $57,971 |
| Interquartile Range (IQR) | $11,894 | $10,078 |
| Standard Deviation (Sample) | $8,951 | $11,163 |
| Standard Deviation (Population) | $8,900 | $11,016 |
Similar Demographics by Median Male Earnings
Demographics Similar to Finns by Median Male Earnings
In terms of median male earnings, the demographic groups most similar to Finns are French Canadian ($54,722, a difference of 0.0%), Immigrants from Peru ($54,695, a difference of 0.050%), Welsh ($54,647, a difference of 0.14%), Immigrants from Vietnam ($54,913, a difference of 0.35%), and South American Indian ($54,508, a difference of 0.39%).
| Demographics | Rating | Rank | Median Male Earnings |
| Ugandans | 68.6 /100 | #163 | Good $55,290 |
| Immigrants | South Eastern Asia | 67.6 /100 | #164 | Good $55,241 |
| Immigrants | Portugal | 66.3 /100 | #165 | Good $55,182 |
| Germans | 61.6 /100 | #166 | Good $54,974 |
| Immigrants | Fiji | 61.2 /100 | #167 | Good $54,958 |
| Immigrants | Vietnam | 60.2 /100 | #168 | Good $54,913 |
| French Canadians | 55.6 /100 | #169 | Average $54,722 |
| Finns | 55.6 /100 | #170 | Average $54,721 |
| Immigrants | Peru | 54.9 /100 | #171 | Average $54,695 |
| Welsh | 53.8 /100 | #172 | Average $54,647 |
| South American Indians | 50.4 /100 | #173 | Average $54,508 |
| South Americans | 50.0 /100 | #174 | Average $54,492 |
| Dutch | 48.0 /100 | #175 | Average $54,410 |
| Spaniards | 47.8 /100 | #176 | Average $54,401 |
| Costa Ricans | 44.8 /100 | #177 | Average $54,279 |
Demographics Similar to Kenyans by Median Male Earnings
In terms of median male earnings, the demographic groups most similar to Kenyans are Scotch-Irish ($53,658, a difference of 0.020%), Guamanian/Chamorro ($53,661, a difference of 0.030%), Uruguayan ($53,680, a difference of 0.060%), Puget Sound Salish ($53,704, a difference of 0.11%), and Immigrants from Eastern Africa ($53,713, a difference of 0.12%).
| Demographics | Rating | Rank | Median Male Earnings |
| Colombians | 34.4 /100 | #186 | Fair $53,832 |
| Immigrants | Eritrea | 31.8 /100 | #187 | Fair $53,715 |
| Immigrants | Eastern Africa | 31.8 /100 | #188 | Fair $53,713 |
| Puget Sound Salish | 31.6 /100 | #189 | Fair $53,704 |
| Uruguayans | 31.1 /100 | #190 | Fair $53,680 |
| Guamanians/Chamorros | 30.7 /100 | #191 | Fair $53,661 |
| Scotch-Irish | 30.6 /100 | #192 | Fair $53,658 |
| Kenyans | 30.4 /100 | #193 | Fair $53,647 |
| Spanish | 29.0 /100 | #194 | Fair $53,576 |
| Immigrants | Azores | 27.5 /100 | #195 | Fair $53,503 |
| Immigrants | Africa | 26.6 /100 | #196 | Fair $53,457 |
| Immigrants | Kenya | 26.0 /100 | #197 | Fair $53,427 |
| Immigrants | Costa Rica | 22.6 /100 | #198 | Fair $53,237 |
| Tongans | 22.3 /100 | #199 | Fair $53,218 |
| Immigrants | Thailand | 17.5 /100 | #200 | Poor $52,908 |