Menominee vs Immigrants from Germany Median Male Earnings
COMPARE
Menominee
Immigrants from Germany
Median Male Earnings
Median Male Earnings Comparison
Menominee
Immigrants from Germany
$42,581
MEDIAN MALE EARNINGS
0.0/ 100
METRIC RATING
337th/ 347
METRIC RANK
$56,542
MEDIAN MALE EARNINGS
88.2/ 100
METRIC RATING
133rd/ 347
METRIC RANK
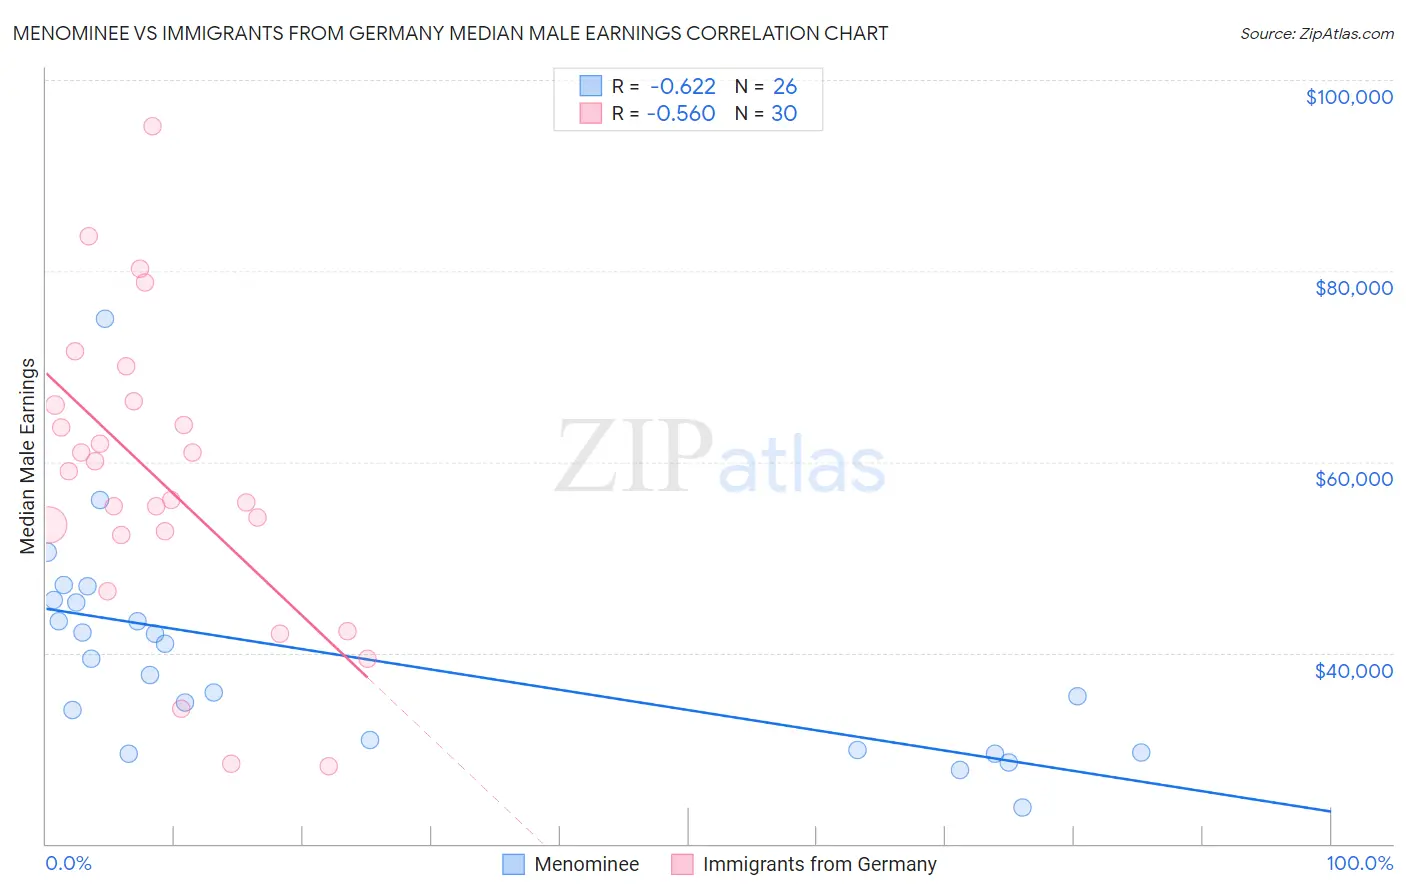
Menominee vs Immigrants from Germany Median Male Earnings Correlation Chart
The statistical analysis conducted on geographies consisting of 45,775,457 people shows a significant negative correlation between the proportion of Menominee and median male earnings in the United States with a correlation coefficient (R) of -0.622 and weighted average of $42,581. Similarly, the statistical analysis conducted on geographies consisting of 463,604,477 people shows a substantial negative correlation between the proportion of Immigrants from Germany and median male earnings in the United States with a correlation coefficient (R) of -0.560 and weighted average of $56,542, a difference of 32.8%.
Median Male Earnings Correlation Summary
| Measurement | Menominee | Immigrants from Germany |
| Minimum | $23,828 | $28,125 |
| Maximum | $75,000 | $95,140 |
| Range | $51,172 | $67,015 |
| Mean | $39,395 | $57,924 |
| Median | $38,495 | $57,493 |
| Interquartile 25% (IQ1) | $29,844 | $52,399 |
| Interquartile 75% (IQ3) | $45,222 | $65,976 |
| Interquartile Range (IQR) | $15,378 | $13,576 |
| Standard Deviation (Sample) | $10,853 | $15,513 |
| Standard Deviation (Population) | $10,643 | $15,253 |
Similar Demographics by Median Male Earnings
Demographics Similar to Menominee by Median Male Earnings
In terms of median male earnings, the demographic groups most similar to Menominee are Crow ($42,434, a difference of 0.35%), Pima ($42,357, a difference of 0.53%), Navajo ($42,098, a difference of 1.1%), Hopi ($42,060, a difference of 1.2%), and Arapaho ($41,758, a difference of 2.0%).
| Demographics | Rating | Rank | Median Male Earnings |
| Immigrants | Mexico | 0.0 /100 | #330 | Tragic $44,960 |
| Natives/Alaskans | 0.0 /100 | #331 | Tragic $44,775 |
| Bahamians | 0.0 /100 | #332 | Tragic $44,756 |
| Immigrants | Congo | 0.0 /100 | #333 | Tragic $44,204 |
| Immigrants | Yemen | 0.0 /100 | #334 | Tragic $44,083 |
| Spanish American Indians | 0.0 /100 | #335 | Tragic $44,010 |
| Immigrants | Cuba | 0.0 /100 | #336 | Tragic $43,461 |
| Menominee | 0.0 /100 | #337 | Tragic $42,581 |
| Crow | 0.0 /100 | #338 | Tragic $42,434 |
| Pima | 0.0 /100 | #339 | Tragic $42,357 |
| Navajo | 0.0 /100 | #340 | Tragic $42,098 |
| Hopi | 0.0 /100 | #341 | Tragic $42,060 |
| Arapaho | 0.0 /100 | #342 | Tragic $41,758 |
| Lumbee | 0.0 /100 | #343 | Tragic $41,715 |
| Pueblo | 0.0 /100 | #344 | Tragic $41,314 |
Demographics Similar to Immigrants from Germany by Median Male Earnings
In terms of median male earnings, the demographic groups most similar to Immigrants from Germany are Czech ($56,546, a difference of 0.010%), Moroccan ($56,499, a difference of 0.080%), Irish ($56,464, a difference of 0.14%), Immigrants from Saudi Arabia ($56,452, a difference of 0.16%), and Portuguese ($56,663, a difference of 0.21%).
| Demographics | Rating | Rank | Median Male Earnings |
| Chinese | 91.1 /100 | #126 | Exceptional $56,872 |
| Brazilians | 90.9 /100 | #127 | Exceptional $56,837 |
| Immigrants | Syria | 90.8 /100 | #128 | Exceptional $56,830 |
| Pakistanis | 89.9 /100 | #129 | Excellent $56,719 |
| Koreans | 89.4 /100 | #130 | Excellent $56,672 |
| Portuguese | 89.4 /100 | #131 | Excellent $56,663 |
| Czechs | 88.2 /100 | #132 | Excellent $56,546 |
| Immigrants | Germany | 88.2 /100 | #133 | Excellent $56,542 |
| Moroccans | 87.7 /100 | #134 | Excellent $56,499 |
| Irish | 87.4 /100 | #135 | Excellent $56,464 |
| Immigrants | Saudi Arabia | 87.2 /100 | #136 | Excellent $56,452 |
| Slavs | 86.5 /100 | #137 | Excellent $56,390 |
| Slovaks | 85.5 /100 | #138 | Excellent $56,306 |
| Zimbabweans | 85.5 /100 | #139 | Excellent $56,302 |
| Luxembourgers | 85.5 /100 | #140 | Excellent $56,300 |