Finnish vs Welsh Median Male Earnings
COMPARE
Finnish
Welsh
Median Male Earnings
Median Male Earnings Comparison
Finns
Welsh
$54,721
MEDIAN MALE EARNINGS
55.6/ 100
METRIC RATING
170th/ 347
METRIC RANK
$54,647
MEDIAN MALE EARNINGS
53.8/ 100
METRIC RATING
172nd/ 347
METRIC RANK
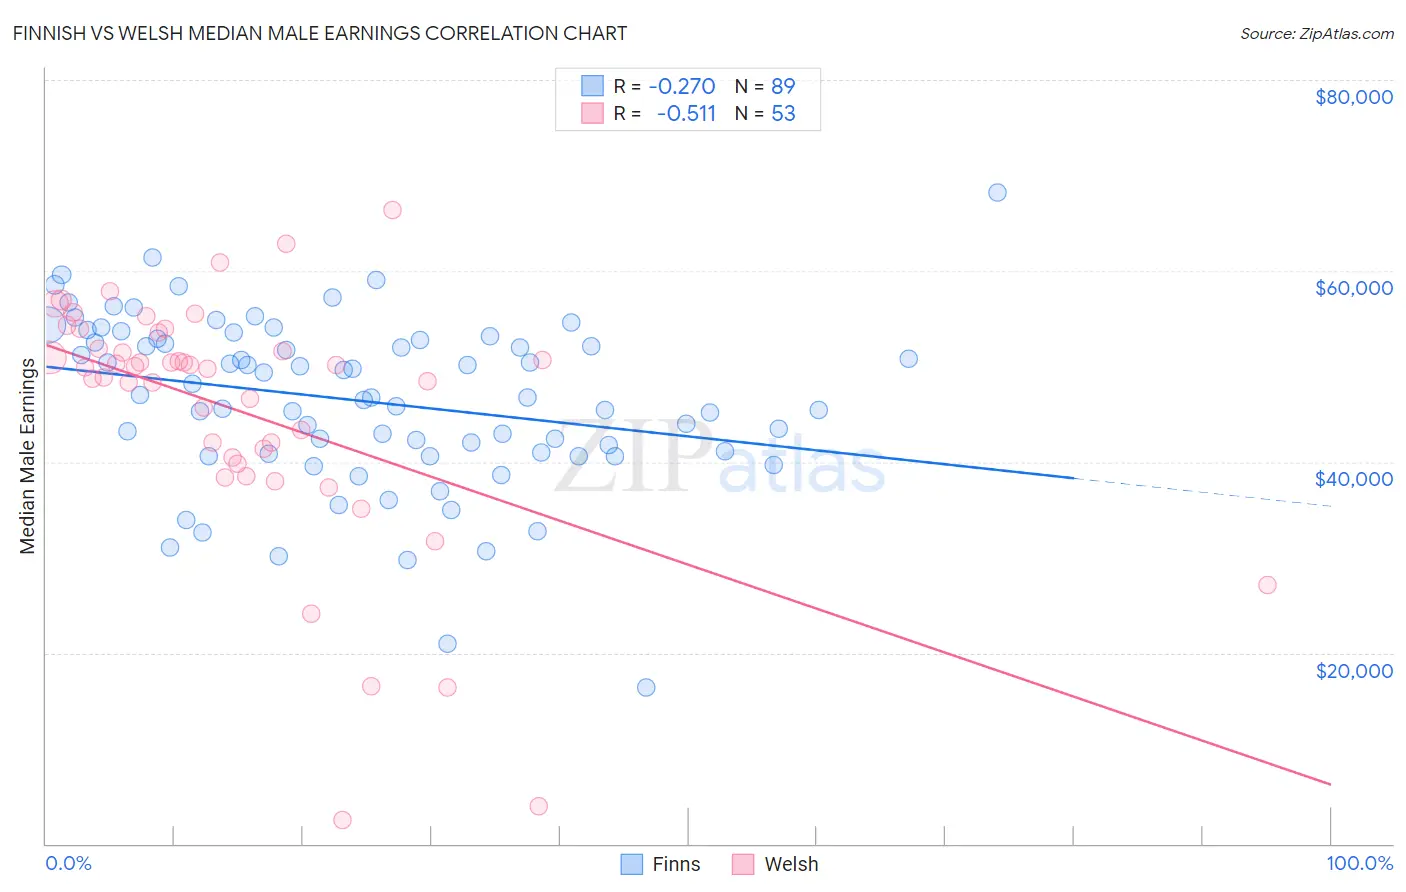
Finnish vs Welsh Median Male Earnings Correlation Chart
The statistical analysis conducted on geographies consisting of 404,473,332 people shows a weak negative correlation between the proportion of Finns and median male earnings in the United States with a correlation coefficient (R) of -0.270 and weighted average of $54,721. Similarly, the statistical analysis conducted on geographies consisting of 527,949,095 people shows a substantial negative correlation between the proportion of Welsh and median male earnings in the United States with a correlation coefficient (R) of -0.511 and weighted average of $54,647, a difference of 0.14%.
Median Male Earnings Correlation Summary
| Measurement | Finnish | Welsh |
| Minimum | $16,413 | $2,499 |
| Maximum | $68,250 | $66,364 |
| Range | $51,837 | $63,865 |
| Mean | $46,398 | $45,194 |
| Median | $46,792 | $49,839 |
| Interquartile 25% (IQ1) | $40,892 | $40,118 |
| Interquartile 75% (IQ3) | $52,786 | $52,741 |
| Interquartile Range (IQR) | $11,894 | $12,623 |
| Standard Deviation (Sample) | $8,951 | $13,217 |
| Standard Deviation (Population) | $8,900 | $13,092 |
Demographics Similar to Finns and Welsh by Median Male Earnings
In terms of median male earnings, the demographic groups most similar to Finns are French Canadian ($54,722, a difference of 0.0%), Immigrants from Peru ($54,695, a difference of 0.050%), Immigrants from Vietnam ($54,913, a difference of 0.35%), South American Indian ($54,508, a difference of 0.39%), and South American ($54,492, a difference of 0.42%). Similarly, the demographic groups most similar to Welsh are Immigrants from Peru ($54,695, a difference of 0.090%), French Canadian ($54,722, a difference of 0.14%), South American Indian ($54,508, a difference of 0.25%), South American ($54,492, a difference of 0.28%), and Dutch ($54,410, a difference of 0.43%).
| Demographics | Rating | Rank | Median Male Earnings |
| Belgians | 70.1 /100 | #161 | Good $55,361 |
| French | 69.9 /100 | #162 | Good $55,350 |
| Ugandans | 68.6 /100 | #163 | Good $55,290 |
| Immigrants | South Eastern Asia | 67.6 /100 | #164 | Good $55,241 |
| Immigrants | Portugal | 66.3 /100 | #165 | Good $55,182 |
| Germans | 61.6 /100 | #166 | Good $54,974 |
| Immigrants | Fiji | 61.2 /100 | #167 | Good $54,958 |
| Immigrants | Vietnam | 60.2 /100 | #168 | Good $54,913 |
| French Canadians | 55.6 /100 | #169 | Average $54,722 |
| Finns | 55.6 /100 | #170 | Average $54,721 |
| Immigrants | Peru | 54.9 /100 | #171 | Average $54,695 |
| Welsh | 53.8 /100 | #172 | Average $54,647 |
| South American Indians | 50.4 /100 | #173 | Average $54,508 |
| South Americans | 50.0 /100 | #174 | Average $54,492 |
| Dutch | 48.0 /100 | #175 | Average $54,410 |
| Spaniards | 47.8 /100 | #176 | Average $54,401 |
| Costa Ricans | 44.8 /100 | #177 | Average $54,279 |
| Sierra Leoneans | 44.8 /100 | #178 | Average $54,279 |
| Celtics | 43.9 /100 | #179 | Average $54,242 |
| Iraqis | 42.5 /100 | #180 | Average $54,182 |
| Immigrants | Immigrants | 42.1 /100 | #181 | Average $54,168 |