Tohono O'odham vs Immigrants from Germany Median Male Earnings
COMPARE
Tohono O'odham
Immigrants from Germany
Median Male Earnings
Median Male Earnings Comparison
Tohono O'odham
Immigrants from Germany
$39,543
MEDIAN MALE EARNINGS
0.0/ 100
METRIC RATING
346th/ 347
METRIC RANK
$56,542
MEDIAN MALE EARNINGS
88.2/ 100
METRIC RATING
133rd/ 347
METRIC RANK
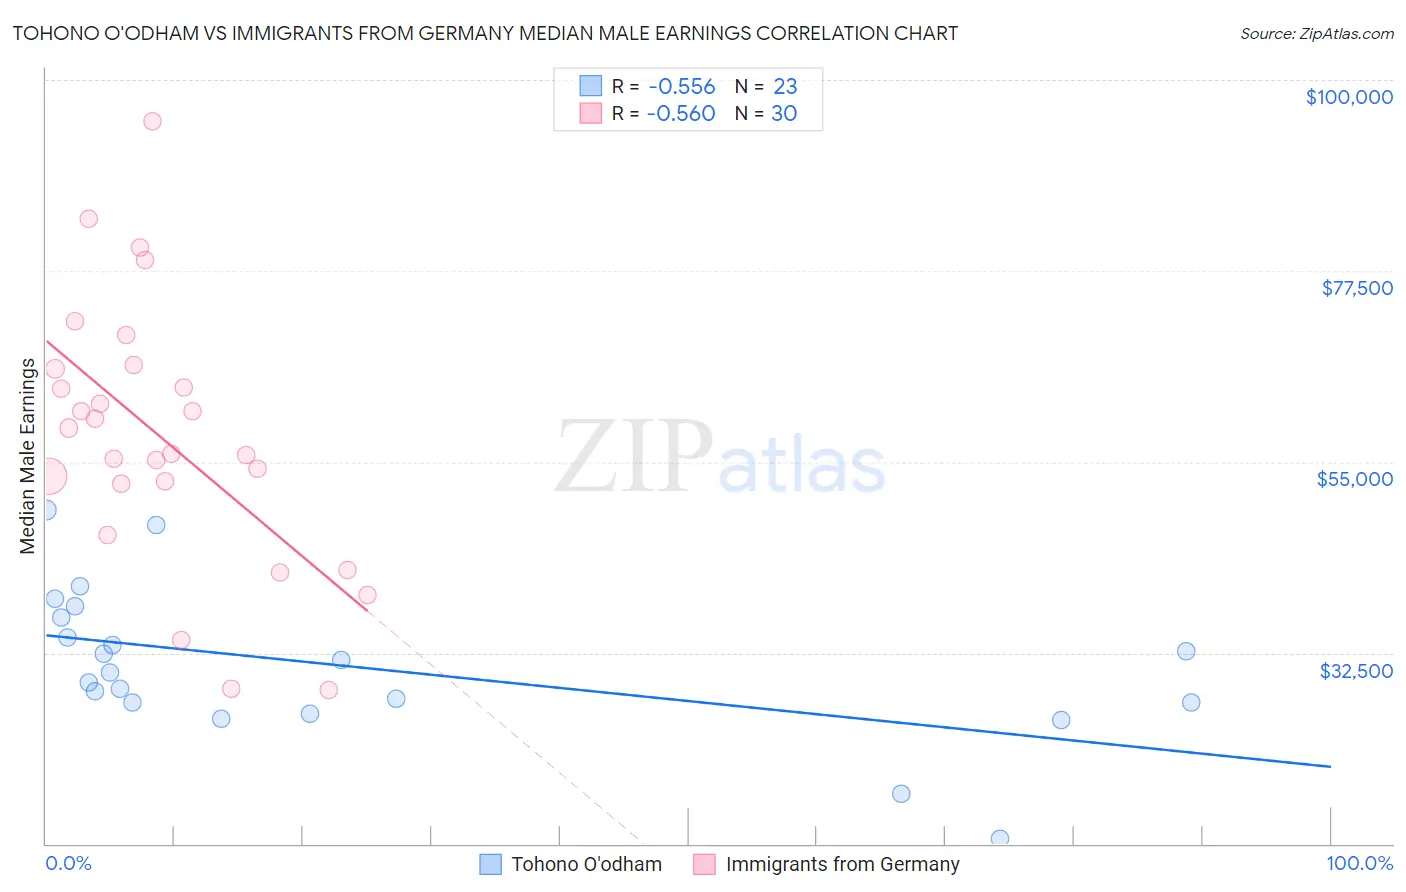
Tohono O'odham vs Immigrants from Germany Median Male Earnings Correlation Chart
The statistical analysis conducted on geographies consisting of 58,721,947 people shows a substantial negative correlation between the proportion of Tohono O'odham and median male earnings in the United States with a correlation coefficient (R) of -0.556 and weighted average of $39,543. Similarly, the statistical analysis conducted on geographies consisting of 463,604,477 people shows a substantial negative correlation between the proportion of Immigrants from Germany and median male earnings in the United States with a correlation coefficient (R) of -0.560 and weighted average of $56,542, a difference of 43.0%.
Median Male Earnings Correlation Summary
| Measurement | Tohono O'odham | Immigrants from Germany |
| Minimum | $10,662 | $28,125 |
| Maximum | $49,303 | $95,140 |
| Range | $38,641 | $67,015 |
| Mean | $30,964 | $57,924 |
| Median | $30,247 | $57,493 |
| Interquartile 25% (IQ1) | $26,584 | $52,399 |
| Interquartile 75% (IQ3) | $36,724 | $65,976 |
| Interquartile Range (IQR) | $10,140 | $13,576 |
| Standard Deviation (Sample) | $8,763 | $15,513 |
| Standard Deviation (Population) | $8,570 | $15,253 |
Similar Demographics by Median Male Earnings
Demographics Similar to Tohono O'odham by Median Male Earnings
In terms of median male earnings, the demographic groups most similar to Tohono O'odham are Yup'ik ($39,504, a difference of 0.10%), Puerto Rican ($40,071, a difference of 1.3%), Pueblo ($41,314, a difference of 4.5%), Lumbee ($41,715, a difference of 5.5%), and Arapaho ($41,758, a difference of 5.6%).
| Demographics | Rating | Rank | Median Male Earnings |
| Immigrants | Congo | 0.0 /100 | #333 | Tragic $44,204 |
| Immigrants | Yemen | 0.0 /100 | #334 | Tragic $44,083 |
| Spanish American Indians | 0.0 /100 | #335 | Tragic $44,010 |
| Immigrants | Cuba | 0.0 /100 | #336 | Tragic $43,461 |
| Menominee | 0.0 /100 | #337 | Tragic $42,581 |
| Crow | 0.0 /100 | #338 | Tragic $42,434 |
| Pima | 0.0 /100 | #339 | Tragic $42,357 |
| Navajo | 0.0 /100 | #340 | Tragic $42,098 |
| Hopi | 0.0 /100 | #341 | Tragic $42,060 |
| Arapaho | 0.0 /100 | #342 | Tragic $41,758 |
| Lumbee | 0.0 /100 | #343 | Tragic $41,715 |
| Pueblo | 0.0 /100 | #344 | Tragic $41,314 |
| Puerto Ricans | 0.0 /100 | #345 | Tragic $40,071 |
| Tohono O'odham | 0.0 /100 | #346 | Tragic $39,543 |
| Yup'ik | 0.0 /100 | #347 | Tragic $39,504 |
Demographics Similar to Immigrants from Germany by Median Male Earnings
In terms of median male earnings, the demographic groups most similar to Immigrants from Germany are Czech ($56,546, a difference of 0.010%), Moroccan ($56,499, a difference of 0.080%), Irish ($56,464, a difference of 0.14%), Immigrants from Saudi Arabia ($56,452, a difference of 0.16%), and Portuguese ($56,663, a difference of 0.21%).
| Demographics | Rating | Rank | Median Male Earnings |
| Chinese | 91.1 /100 | #126 | Exceptional $56,872 |
| Brazilians | 90.9 /100 | #127 | Exceptional $56,837 |
| Immigrants | Syria | 90.8 /100 | #128 | Exceptional $56,830 |
| Pakistanis | 89.9 /100 | #129 | Excellent $56,719 |
| Koreans | 89.4 /100 | #130 | Excellent $56,672 |
| Portuguese | 89.4 /100 | #131 | Excellent $56,663 |
| Czechs | 88.2 /100 | #132 | Excellent $56,546 |
| Immigrants | Germany | 88.2 /100 | #133 | Excellent $56,542 |
| Moroccans | 87.7 /100 | #134 | Excellent $56,499 |
| Irish | 87.4 /100 | #135 | Excellent $56,464 |
| Immigrants | Saudi Arabia | 87.2 /100 | #136 | Excellent $56,452 |
| Slavs | 86.5 /100 | #137 | Excellent $56,390 |
| Slovaks | 85.5 /100 | #138 | Excellent $56,306 |
| Zimbabweans | 85.5 /100 | #139 | Excellent $56,302 |
| Luxembourgers | 85.5 /100 | #140 | Excellent $56,300 |