Finnish vs Immigrants from Germany In Labor Force | Age 16-19
COMPARE
Finnish
Immigrants from Germany
In Labor Force | Age 16-19
In Labor Force | Age 16-19 Comparison
Finns
Immigrants from Germany
43.9%
IN LABOR FORCE | AGE 16-19
100.0/ 100
METRIC RATING
12th/ 347
METRIC RANK
39.1%
IN LABOR FORCE | AGE 16-19
99.6/ 100
METRIC RATING
87th/ 347
METRIC RANK
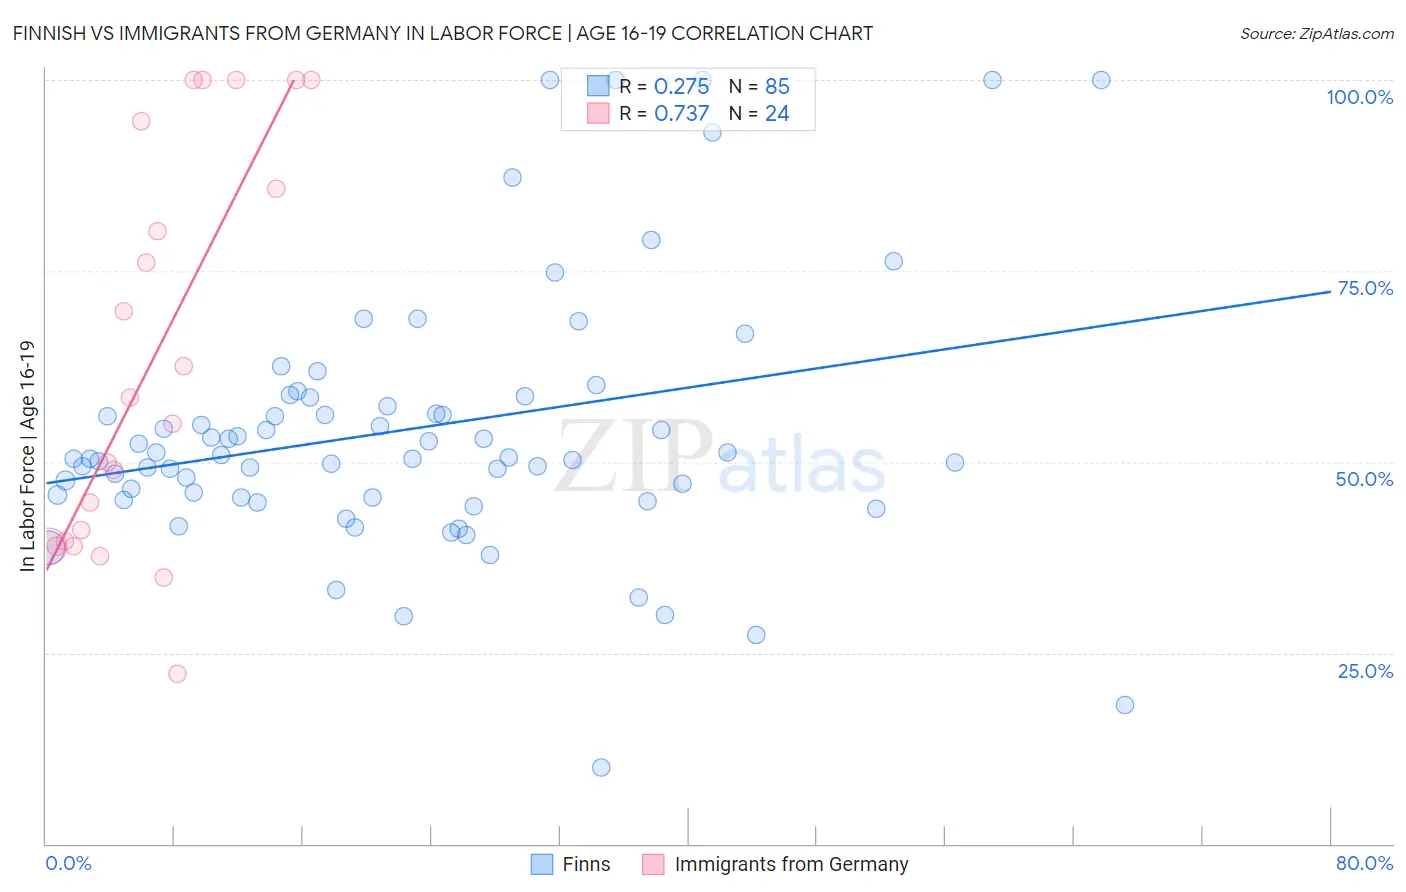
Finnish vs Immigrants from Germany In Labor Force | Age 16-19 Correlation Chart
The statistical analysis conducted on geographies consisting of 403,764,919 people shows a weak positive correlation between the proportion of Finns and labor force participation rate among population between the ages 16 and 19 in the United States with a correlation coefficient (R) of 0.275 and weighted average of 43.9%. Similarly, the statistical analysis conducted on geographies consisting of 462,642,195 people shows a strong positive correlation between the proportion of Immigrants from Germany and labor force participation rate among population between the ages 16 and 19 in the United States with a correlation coefficient (R) of 0.737 and weighted average of 39.1%, a difference of 12.3%.
In Labor Force | Age 16-19 Correlation Summary
| Measurement | Finnish | Immigrants from Germany |
| Minimum | 10.0% | 22.2% |
| Maximum | 100.0% | 100.0% |
| Range | 90.0% | 77.8% |
| Mean | 54.5% | 63.2% |
| Median | 50.6% | 56.7% |
| Interquartile 25% (IQ1) | 45.4% | 39.3% |
| Interquartile 75% (IQ3) | 58.5% | 90.1% |
| Interquartile Range (IQR) | 13.1% | 50.8% |
| Standard Deviation (Sample) | 17.8% | 26.0% |
| Standard Deviation (Population) | 17.7% | 25.4% |
Similar Demographics by In Labor Force | Age 16-19
Demographics Similar to Finns by In Labor Force | Age 16-19
In terms of in labor force | age 16-19, the demographic groups most similar to Finns are Dutch (43.8%, a difference of 0.19%), Chippewa (43.8%, a difference of 0.29%), Swedish (44.1%, a difference of 0.46%), German (44.2%, a difference of 0.54%), and Slovene (43.7%, a difference of 0.55%).
| Demographics | Rating | Rank | In Labor Force | Age 16-19 |
| Alaskan Athabascans | 100.0 /100 | #5 | Exceptional 45.2% |
| Somalis | 100.0 /100 | #6 | Exceptional 45.1% |
| Danes | 100.0 /100 | #7 | Exceptional 44.7% |
| Immigrants | Cabo Verde | 100.0 /100 | #8 | Exceptional 44.7% |
| Cape Verdeans | 100.0 /100 | #9 | Exceptional 44.5% |
| Germans | 100.0 /100 | #10 | Exceptional 44.2% |
| Swedes | 100.0 /100 | #11 | Exceptional 44.1% |
| Finns | 100.0 /100 | #12 | Exceptional 43.9% |
| Dutch | 100.0 /100 | #13 | Exceptional 43.8% |
| Chippewa | 100.0 /100 | #14 | Exceptional 43.8% |
| Slovenes | 100.0 /100 | #15 | Exceptional 43.7% |
| Czechs | 100.0 /100 | #16 | Exceptional 43.6% |
| Scandinavians | 100.0 /100 | #17 | Exceptional 43.6% |
| French Canadians | 100.0 /100 | #18 | Exceptional 43.6% |
| Belgians | 100.0 /100 | #19 | Exceptional 43.4% |
Demographics Similar to Immigrants from Germany by In Labor Force | Age 16-19
In terms of in labor force | age 16-19, the demographic groups most similar to Immigrants from Germany are Puget Sound Salish (39.1%, a difference of 0.070%), Samoan (39.1%, a difference of 0.080%), Alaska Native (39.1%, a difference of 0.080%), Creek (39.1%, a difference of 0.10%), and Immigrants from Burma/Myanmar (39.0%, a difference of 0.16%).
| Demographics | Rating | Rank | In Labor Force | Age 16-19 |
| Immigrants | Iraq | 99.8 /100 | #80 | Exceptional 39.4% |
| Shoshone | 99.7 /100 | #81 | Exceptional 39.3% |
| Basques | 99.7 /100 | #82 | Exceptional 39.3% |
| Spanish | 99.7 /100 | #83 | Exceptional 39.3% |
| Immigrants | Uganda | 99.7 /100 | #84 | Exceptional 39.2% |
| Creek | 99.6 /100 | #85 | Exceptional 39.1% |
| Samoans | 99.6 /100 | #86 | Exceptional 39.1% |
| Immigrants | Germany | 99.6 /100 | #87 | Exceptional 39.1% |
| Puget Sound Salish | 99.6 /100 | #88 | Exceptional 39.1% |
| Alaska Natives | 99.6 /100 | #89 | Exceptional 39.1% |
| Immigrants | Burma/Myanmar | 99.5 /100 | #90 | Exceptional 39.0% |
| Spanish Americans | 99.5 /100 | #91 | Exceptional 39.0% |
| Osage | 99.4 /100 | #92 | Exceptional 39.0% |
| Blackfeet | 99.4 /100 | #93 | Exceptional 38.9% |
| Immigrants | Canada | 99.4 /100 | #94 | Exceptional 38.9% |