Finnish vs Immigrants from Eritrea Median Male Earnings
COMPARE
Finnish
Immigrants from Eritrea
Median Male Earnings
Median Male Earnings Comparison
Finns
Immigrants from Eritrea
$54,721
MEDIAN MALE EARNINGS
55.6/ 100
METRIC RATING
170th/ 347
METRIC RANK
$53,715
MEDIAN MALE EARNINGS
31.8/ 100
METRIC RATING
187th/ 347
METRIC RANK
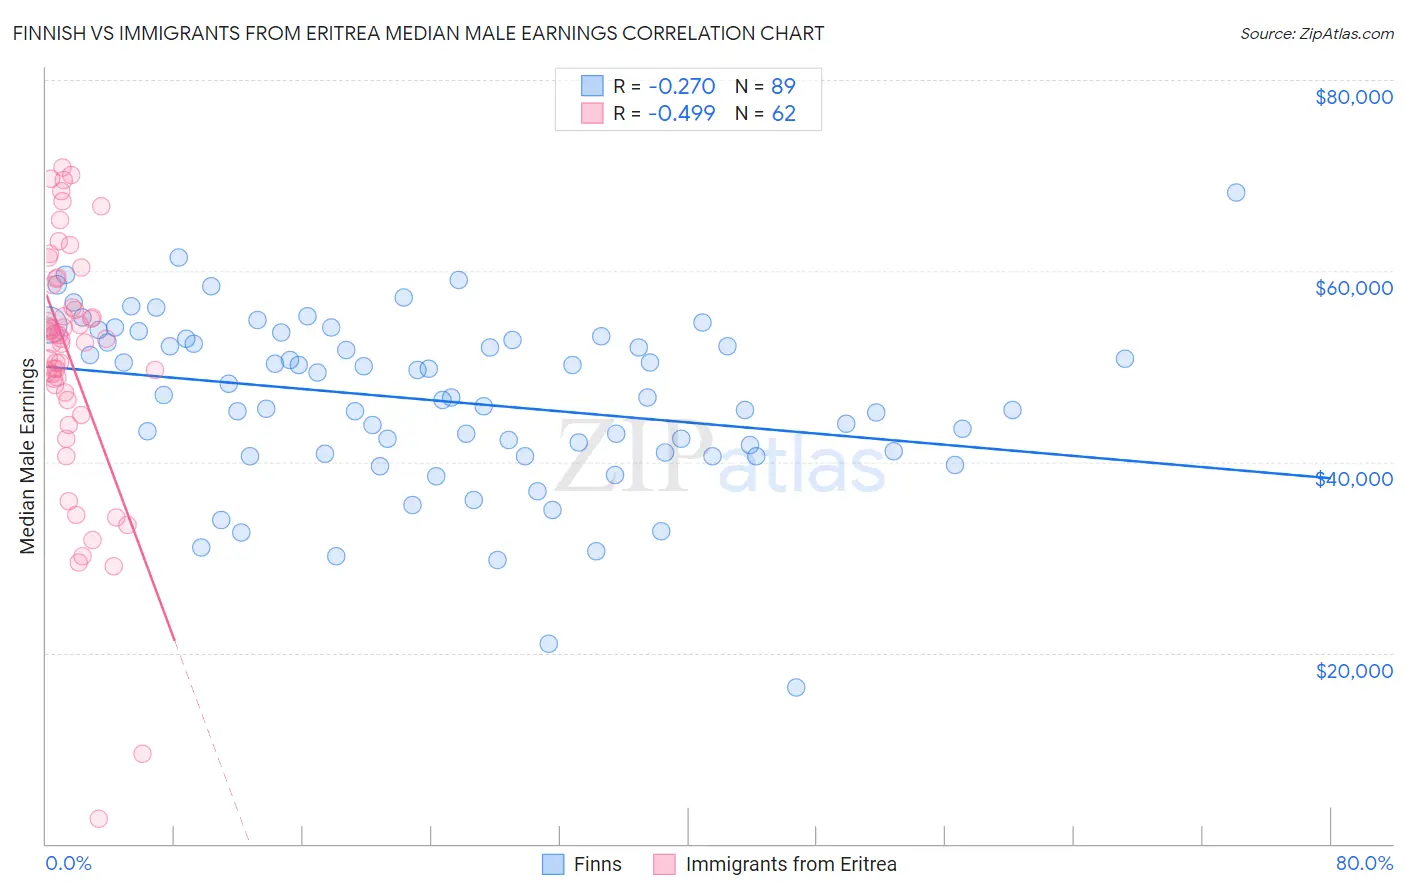
Finnish vs Immigrants from Eritrea Median Male Earnings Correlation Chart
The statistical analysis conducted on geographies consisting of 404,473,332 people shows a weak negative correlation between the proportion of Finns and median male earnings in the United States with a correlation coefficient (R) of -0.270 and weighted average of $54,721. Similarly, the statistical analysis conducted on geographies consisting of 104,828,804 people shows a moderate negative correlation between the proportion of Immigrants from Eritrea and median male earnings in the United States with a correlation coefficient (R) of -0.499 and weighted average of $53,715, a difference of 1.9%.
Median Male Earnings Correlation Summary
| Measurement | Finnish | Immigrants from Eritrea |
| Minimum | $16,413 | $2,614 |
| Maximum | $68,250 | $70,824 |
| Range | $51,837 | $68,210 |
| Mean | $46,398 | $50,677 |
| Median | $46,792 | $52,865 |
| Interquartile 25% (IQ1) | $40,892 | $47,273 |
| Interquartile 75% (IQ3) | $52,786 | $58,480 |
| Interquartile Range (IQR) | $11,894 | $11,207 |
| Standard Deviation (Sample) | $8,951 | $13,241 |
| Standard Deviation (Population) | $8,900 | $13,134 |
Demographics Similar to Finns and Immigrants from Eritrea by Median Male Earnings
In terms of median male earnings, the demographic groups most similar to Finns are French Canadian ($54,722, a difference of 0.0%), Immigrants from Peru ($54,695, a difference of 0.050%), Welsh ($54,647, a difference of 0.14%), Immigrants from Vietnam ($54,913, a difference of 0.35%), and South American Indian ($54,508, a difference of 0.39%). Similarly, the demographic groups most similar to Immigrants from Eritrea are Immigrants from Eastern Africa ($53,713, a difference of 0.0%), Colombian ($53,832, a difference of 0.22%), Immigrants from Sierra Leone ($53,905, a difference of 0.35%), White/Caucasian ($53,925, a difference of 0.39%), and Immigrants from South America ($53,962, a difference of 0.46%).
| Demographics | Rating | Rank | Median Male Earnings |
| Immigrants | Vietnam | 60.2 /100 | #168 | Good $54,913 |
| French Canadians | 55.6 /100 | #169 | Average $54,722 |
| Finns | 55.6 /100 | #170 | Average $54,721 |
| Immigrants | Peru | 54.9 /100 | #171 | Average $54,695 |
| Welsh | 53.8 /100 | #172 | Average $54,647 |
| South American Indians | 50.4 /100 | #173 | Average $54,508 |
| South Americans | 50.0 /100 | #174 | Average $54,492 |
| Dutch | 48.0 /100 | #175 | Average $54,410 |
| Spaniards | 47.8 /100 | #176 | Average $54,401 |
| Costa Ricans | 44.8 /100 | #177 | Average $54,279 |
| Sierra Leoneans | 44.8 /100 | #178 | Average $54,279 |
| Celtics | 43.9 /100 | #179 | Average $54,242 |
| Iraqis | 42.5 /100 | #180 | Average $54,182 |
| Immigrants | Immigrants | 42.1 /100 | #181 | Average $54,168 |
| Yugoslavians | 37.4 /100 | #182 | Fair $53,967 |
| Immigrants | South America | 37.3 /100 | #183 | Fair $53,962 |
| Whites/Caucasians | 36.5 /100 | #184 | Fair $53,925 |
| Immigrants | Sierra Leone | 36.0 /100 | #185 | Fair $53,905 |
| Colombians | 34.4 /100 | #186 | Fair $53,832 |
| Immigrants | Eritrea | 31.8 /100 | #187 | Fair $53,715 |
| Immigrants | Eastern Africa | 31.8 /100 | #188 | Fair $53,713 |