Immigrants from Canada vs Immigrants from Germany Median Male Earnings
COMPARE
Immigrants from Canada
Immigrants from Germany
Median Male Earnings
Median Male Earnings Comparison
Immigrants from Canada
Immigrants from Germany
$60,388
MEDIAN MALE EARNINGS
99.7/ 100
METRIC RATING
69th/ 347
METRIC RANK
$56,542
MEDIAN MALE EARNINGS
88.2/ 100
METRIC RATING
133rd/ 347
METRIC RANK
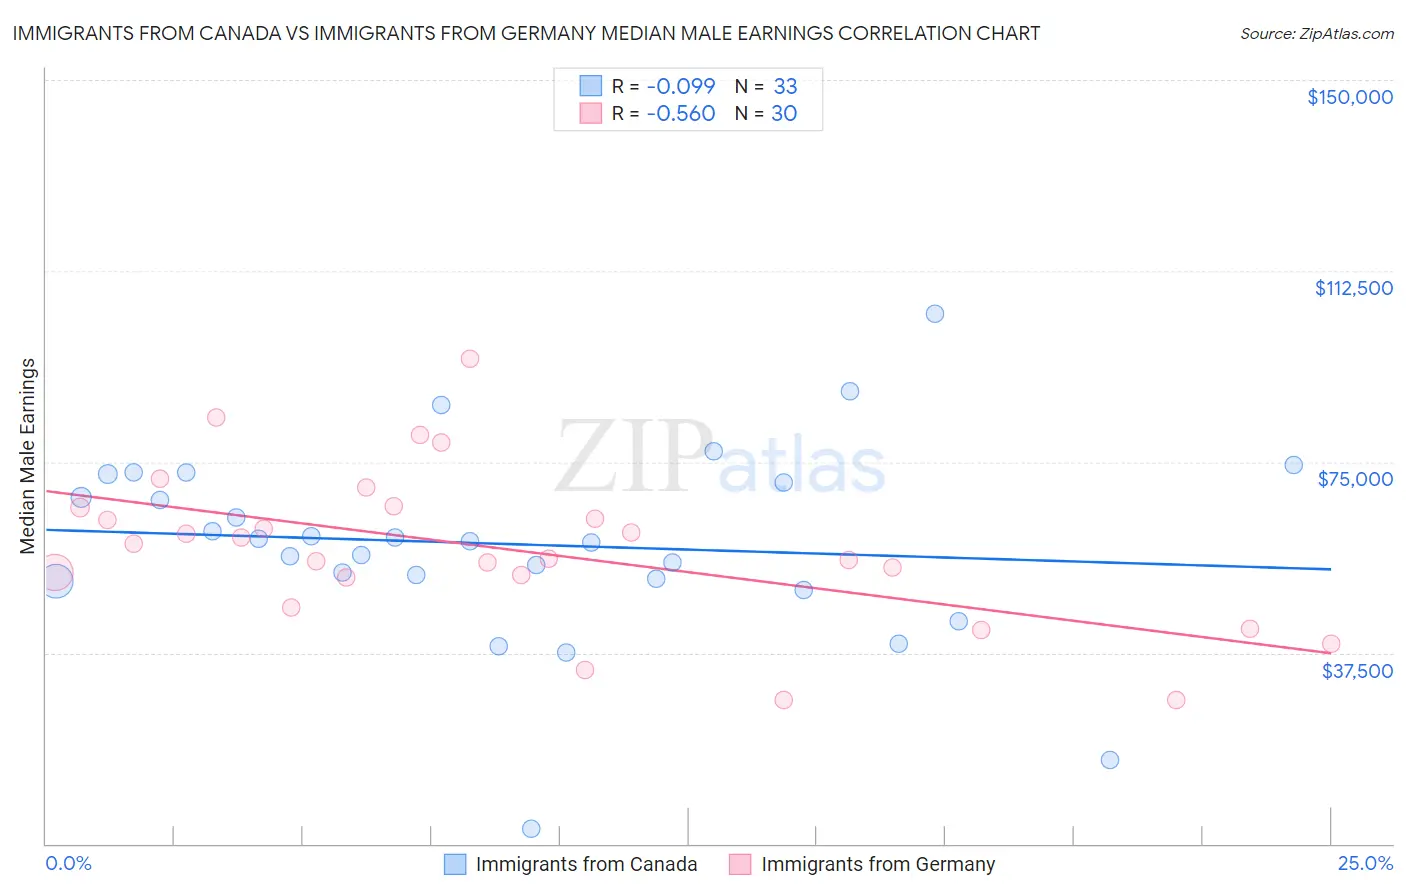
Immigrants from Canada vs Immigrants from Germany Median Male Earnings Correlation Chart
The statistical analysis conducted on geographies consisting of 459,122,230 people shows a slight negative correlation between the proportion of Immigrants from Canada and median male earnings in the United States with a correlation coefficient (R) of -0.099 and weighted average of $60,388. Similarly, the statistical analysis conducted on geographies consisting of 463,604,477 people shows a substantial negative correlation between the proportion of Immigrants from Germany and median male earnings in the United States with a correlation coefficient (R) of -0.560 and weighted average of $56,542, a difference of 6.8%.
Median Male Earnings Correlation Summary
| Measurement | Immigrants from Canada | Immigrants from Germany |
| Minimum | $2,875 | $28,125 |
| Maximum | $104,091 | $95,140 |
| Range | $101,216 | $67,015 |
| Mean | $58,839 | $57,924 |
| Median | $59,365 | $57,493 |
| Interquartile 25% (IQ1) | $51,760 | $52,399 |
| Interquartile 75% (IQ3) | $71,783 | $65,976 |
| Interquartile Range (IQR) | $20,022 | $13,576 |
| Standard Deviation (Sample) | $19,265 | $15,513 |
| Standard Deviation (Population) | $18,971 | $15,253 |
Similar Demographics by Median Male Earnings
Demographics Similar to Immigrants from Canada by Median Male Earnings
In terms of median male earnings, the demographic groups most similar to Immigrants from Canada are Immigrants from Bulgaria ($60,358, a difference of 0.050%), Mongolian ($60,350, a difference of 0.060%), Immigrants from Western Europe ($60,334, a difference of 0.090%), Immigrants from North America ($60,265, a difference of 0.20%), and Immigrants from Serbia ($60,600, a difference of 0.35%).
| Demographics | Rating | Rank | Median Male Earnings |
| Immigrants | Romania | 99.8 /100 | #62 | Exceptional $61,040 |
| Immigrants | Pakistan | 99.8 /100 | #63 | Exceptional $60,987 |
| Immigrants | Eastern Europe | 99.8 /100 | #64 | Exceptional $60,958 |
| Immigrants | Indonesia | 99.8 /100 | #65 | Exceptional $60,935 |
| Immigrants | Croatia | 99.8 /100 | #66 | Exceptional $60,914 |
| Immigrants | Spain | 99.8 /100 | #67 | Exceptional $60,750 |
| Immigrants | Serbia | 99.7 /100 | #68 | Exceptional $60,600 |
| Immigrants | Canada | 99.7 /100 | #69 | Exceptional $60,388 |
| Immigrants | Bulgaria | 99.7 /100 | #70 | Exceptional $60,358 |
| Mongolians | 99.7 /100 | #71 | Exceptional $60,350 |
| Immigrants | Western Europe | 99.7 /100 | #72 | Exceptional $60,334 |
| Immigrants | North America | 99.7 /100 | #73 | Exceptional $60,265 |
| Argentineans | 99.6 /100 | #74 | Exceptional $60,117 |
| Immigrants | Bolivia | 99.6 /100 | #75 | Exceptional $60,088 |
| Romanians | 99.6 /100 | #76 | Exceptional $60,063 |
Demographics Similar to Immigrants from Germany by Median Male Earnings
In terms of median male earnings, the demographic groups most similar to Immigrants from Germany are Czech ($56,546, a difference of 0.010%), Moroccan ($56,499, a difference of 0.080%), Irish ($56,464, a difference of 0.14%), Immigrants from Saudi Arabia ($56,452, a difference of 0.16%), and Portuguese ($56,663, a difference of 0.21%).
| Demographics | Rating | Rank | Median Male Earnings |
| Chinese | 91.1 /100 | #126 | Exceptional $56,872 |
| Brazilians | 90.9 /100 | #127 | Exceptional $56,837 |
| Immigrants | Syria | 90.8 /100 | #128 | Exceptional $56,830 |
| Pakistanis | 89.9 /100 | #129 | Excellent $56,719 |
| Koreans | 89.4 /100 | #130 | Excellent $56,672 |
| Portuguese | 89.4 /100 | #131 | Excellent $56,663 |
| Czechs | 88.2 /100 | #132 | Excellent $56,546 |
| Immigrants | Germany | 88.2 /100 | #133 | Excellent $56,542 |
| Moroccans | 87.7 /100 | #134 | Excellent $56,499 |
| Irish | 87.4 /100 | #135 | Excellent $56,464 |
| Immigrants | Saudi Arabia | 87.2 /100 | #136 | Excellent $56,452 |
| Slavs | 86.5 /100 | #137 | Excellent $56,390 |
| Slovaks | 85.5 /100 | #138 | Excellent $56,306 |
| Zimbabweans | 85.5 /100 | #139 | Excellent $56,302 |
| Luxembourgers | 85.5 /100 | #140 | Excellent $56,300 |