Immigrants from Nepal vs Immigrants from Germany Median Male Earnings
COMPARE
Immigrants from Nepal
Immigrants from Germany
Median Male Earnings
Median Male Earnings Comparison
Immigrants from Nepal
Immigrants from Germany
$55,615
MEDIAN MALE EARNINGS
75.0/ 100
METRIC RATING
153rd/ 347
METRIC RANK
$56,542
MEDIAN MALE EARNINGS
88.2/ 100
METRIC RATING
133rd/ 347
METRIC RANK
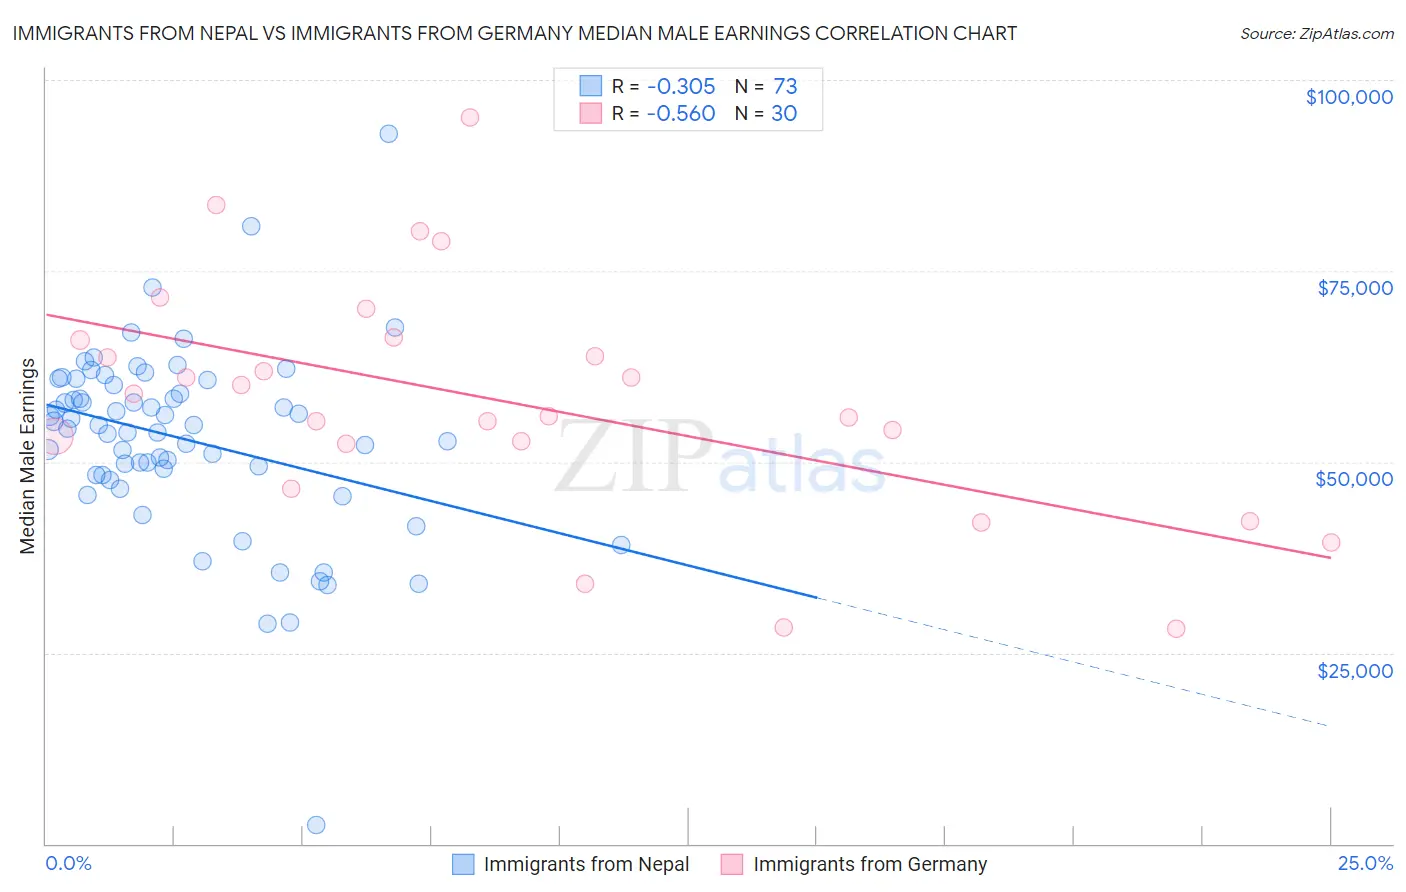
Immigrants from Nepal vs Immigrants from Germany Median Male Earnings Correlation Chart
The statistical analysis conducted on geographies consisting of 186,778,283 people shows a mild negative correlation between the proportion of Immigrants from Nepal and median male earnings in the United States with a correlation coefficient (R) of -0.305 and weighted average of $55,615. Similarly, the statistical analysis conducted on geographies consisting of 463,604,477 people shows a substantial negative correlation between the proportion of Immigrants from Germany and median male earnings in the United States with a correlation coefficient (R) of -0.560 and weighted average of $56,542, a difference of 1.7%.
Median Male Earnings Correlation Summary
| Measurement | Immigrants from Nepal | Immigrants from Germany |
| Minimum | $2,499 | $28,125 |
| Maximum | $93,000 | $95,140 |
| Range | $90,501 | $67,015 |
| Mean | $52,957 | $57,924 |
| Median | $54,879 | $57,493 |
| Interquartile 25% (IQ1) | $48,301 | $52,399 |
| Interquartile 75% (IQ3) | $60,442 | $65,976 |
| Interquartile Range (IQR) | $12,141 | $13,576 |
| Standard Deviation (Sample) | $12,480 | $15,513 |
| Standard Deviation (Population) | $12,394 | $15,253 |
Demographics Similar to Immigrants from Nepal and Immigrants from Germany by Median Male Earnings
In terms of median male earnings, the demographic groups most similar to Immigrants from Nepal are Peruvian ($55,659, a difference of 0.080%), Immigrants from Oceania ($55,712, a difference of 0.17%), Swiss ($55,731, a difference of 0.21%), English ($55,747, a difference of 0.24%), and Scottish ($55,793, a difference of 0.32%). Similarly, the demographic groups most similar to Immigrants from Germany are Moroccan ($56,499, a difference of 0.080%), Irish ($56,464, a difference of 0.14%), Immigrants from Saudi Arabia ($56,452, a difference of 0.16%), Slavic ($56,390, a difference of 0.27%), and Slovak ($56,306, a difference of 0.42%).
| Demographics | Rating | Rank | Median Male Earnings |
| Immigrants | Germany | 88.2 /100 | #133 | Excellent $56,542 |
| Moroccans | 87.7 /100 | #134 | Excellent $56,499 |
| Irish | 87.4 /100 | #135 | Excellent $56,464 |
| Immigrants | Saudi Arabia | 87.2 /100 | #136 | Excellent $56,452 |
| Slavs | 86.5 /100 | #137 | Excellent $56,390 |
| Slovaks | 85.5 /100 | #138 | Excellent $56,306 |
| Zimbabweans | 85.5 /100 | #139 | Excellent $56,302 |
| Luxembourgers | 85.5 /100 | #140 | Excellent $56,300 |
| Danes | 84.8 /100 | #141 | Excellent $56,246 |
| Ethiopians | 84.8 /100 | #142 | Excellent $56,243 |
| Sri Lankans | 83.4 /100 | #143 | Excellent $56,136 |
| Immigrants | Uganda | 82.4 /100 | #144 | Excellent $56,064 |
| Norwegians | 80.9 /100 | #145 | Excellent $55,965 |
| Immigrants | Chile | 80.7 /100 | #146 | Excellent $55,954 |
| Immigrants | Philippines | 78.4 /100 | #147 | Good $55,809 |
| Scottish | 78.2 /100 | #148 | Good $55,793 |
| English | 77.4 /100 | #149 | Good $55,747 |
| Swiss | 77.1 /100 | #150 | Good $55,731 |
| Immigrants | Oceania | 76.8 /100 | #151 | Good $55,712 |
| Peruvians | 75.8 /100 | #152 | Good $55,659 |
| Immigrants | Nepal | 75.0 /100 | #153 | Good $55,615 |