Greek vs Immigrants from Germany Median Male Earnings
COMPARE
Greek
Immigrants from Germany
Median Male Earnings
Median Male Earnings Comparison
Greeks
Immigrants from Germany
$61,242
MEDIAN MALE EARNINGS
99.9/ 100
METRIC RATING
55th/ 347
METRIC RANK
$56,542
MEDIAN MALE EARNINGS
88.2/ 100
METRIC RATING
133rd/ 347
METRIC RANK
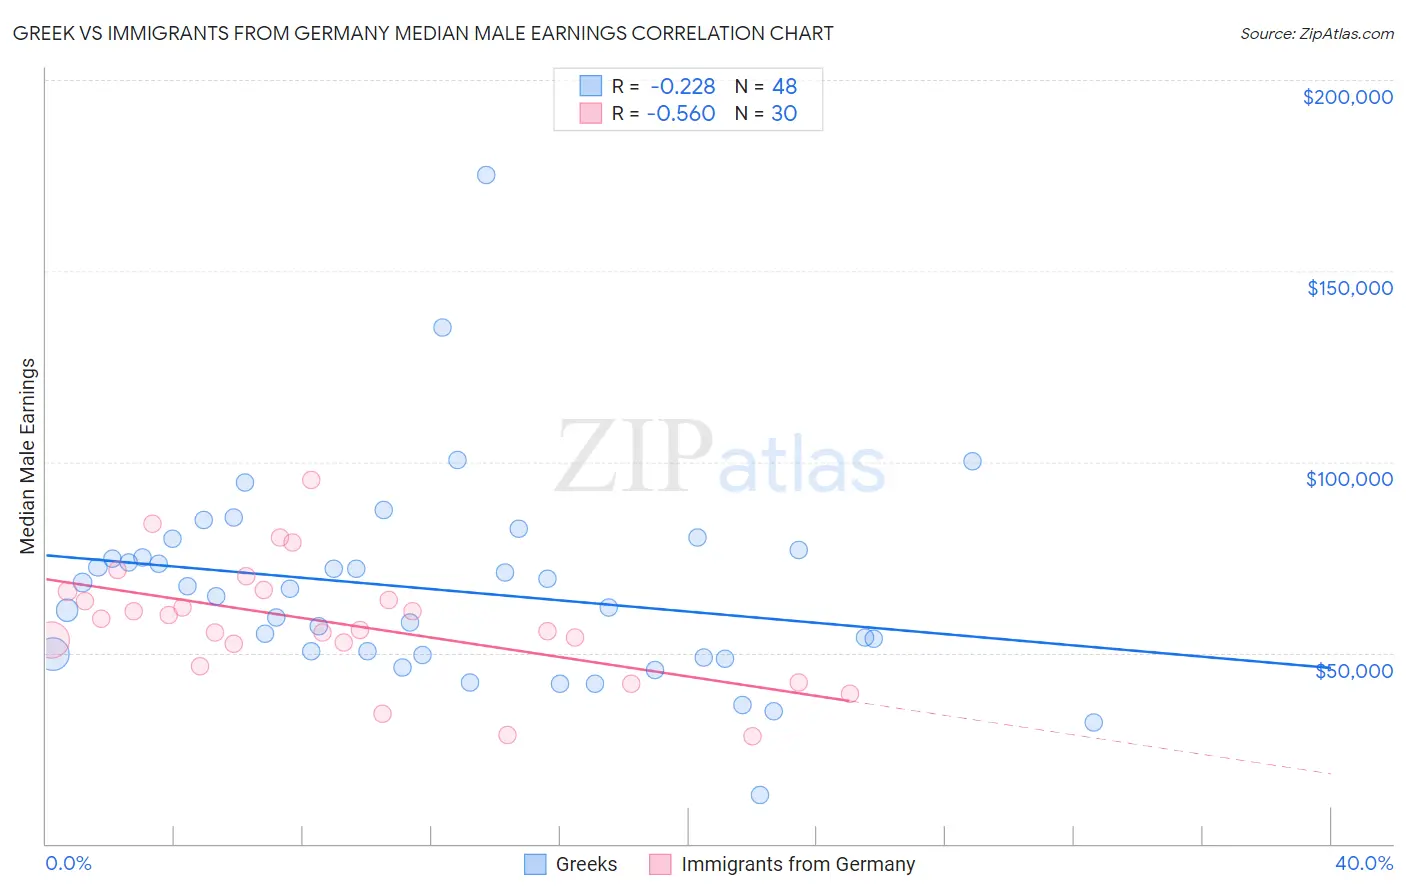
Greek vs Immigrants from Germany Median Male Earnings Correlation Chart
The statistical analysis conducted on geographies consisting of 482,499,684 people shows a weak negative correlation between the proportion of Greeks and median male earnings in the United States with a correlation coefficient (R) of -0.228 and weighted average of $61,242. Similarly, the statistical analysis conducted on geographies consisting of 463,604,477 people shows a substantial negative correlation between the proportion of Immigrants from Germany and median male earnings in the United States with a correlation coefficient (R) of -0.560 and weighted average of $56,542, a difference of 8.3%.
Median Male Earnings Correlation Summary
| Measurement | Greek | Immigrants from Germany |
| Minimum | $12,679 | $28,125 |
| Maximum | $175,000 | $95,140 |
| Range | $162,321 | $67,015 |
| Mean | $66,512 | $57,924 |
| Median | $65,740 | $57,493 |
| Interquartile 25% (IQ1) | $49,612 | $52,399 |
| Interquartile 75% (IQ3) | $75,987 | $65,976 |
| Interquartile Range (IQR) | $26,375 | $13,576 |
| Standard Deviation (Sample) | $26,480 | $15,513 |
| Standard Deviation (Population) | $26,203 | $15,253 |
Similar Demographics by Median Male Earnings
Demographics Similar to Greeks by Median Male Earnings
In terms of median male earnings, the demographic groups most similar to Greeks are Lithuanian ($61,228, a difference of 0.020%), Immigrants from Scotland ($61,220, a difference of 0.040%), New Zealander ($61,199, a difference of 0.070%), Immigrants from Netherlands ($61,096, a difference of 0.24%), and Egyptian ($61,095, a difference of 0.24%).
| Demographics | Rating | Rank | Median Male Earnings |
| Immigrants | Malaysia | 99.9 /100 | #48 | Exceptional $62,121 |
| Immigrants | Europe | 99.9 /100 | #49 | Exceptional $62,057 |
| Bhutanese | 99.9 /100 | #50 | Exceptional $61,759 |
| Estonians | 99.9 /100 | #51 | Exceptional $61,710 |
| Immigrants | Norway | 99.9 /100 | #52 | Exceptional $61,628 |
| South Africans | 99.9 /100 | #53 | Exceptional $61,460 |
| Immigrants | Latvia | 99.9 /100 | #54 | Exceptional $61,422 |
| Greeks | 99.9 /100 | #55 | Exceptional $61,242 |
| Lithuanians | 99.9 /100 | #56 | Exceptional $61,228 |
| Immigrants | Scotland | 99.9 /100 | #57 | Exceptional $61,220 |
| New Zealanders | 99.9 /100 | #58 | Exceptional $61,199 |
| Immigrants | Netherlands | 99.8 /100 | #59 | Exceptional $61,096 |
| Egyptians | 99.8 /100 | #60 | Exceptional $61,095 |
| Bolivians | 99.8 /100 | #61 | Exceptional $61,066 |
| Immigrants | Romania | 99.8 /100 | #62 | Exceptional $61,040 |
Demographics Similar to Immigrants from Germany by Median Male Earnings
In terms of median male earnings, the demographic groups most similar to Immigrants from Germany are Czech ($56,546, a difference of 0.010%), Moroccan ($56,499, a difference of 0.080%), Irish ($56,464, a difference of 0.14%), Immigrants from Saudi Arabia ($56,452, a difference of 0.16%), and Portuguese ($56,663, a difference of 0.21%).
| Demographics | Rating | Rank | Median Male Earnings |
| Chinese | 91.1 /100 | #126 | Exceptional $56,872 |
| Brazilians | 90.9 /100 | #127 | Exceptional $56,837 |
| Immigrants | Syria | 90.8 /100 | #128 | Exceptional $56,830 |
| Pakistanis | 89.9 /100 | #129 | Excellent $56,719 |
| Koreans | 89.4 /100 | #130 | Excellent $56,672 |
| Portuguese | 89.4 /100 | #131 | Excellent $56,663 |
| Czechs | 88.2 /100 | #132 | Excellent $56,546 |
| Immigrants | Germany | 88.2 /100 | #133 | Excellent $56,542 |
| Moroccans | 87.7 /100 | #134 | Excellent $56,499 |
| Irish | 87.4 /100 | #135 | Excellent $56,464 |
| Immigrants | Saudi Arabia | 87.2 /100 | #136 | Excellent $56,452 |
| Slavs | 86.5 /100 | #137 | Excellent $56,390 |
| Slovaks | 85.5 /100 | #138 | Excellent $56,306 |
| Zimbabweans | 85.5 /100 | #139 | Excellent $56,302 |
| Luxembourgers | 85.5 /100 | #140 | Excellent $56,300 |