Finnish vs Bolivian Median Male Earnings
COMPARE
Finnish
Bolivian
Median Male Earnings
Median Male Earnings Comparison
Finns
Bolivians
$54,721
MEDIAN MALE EARNINGS
55.6/ 100
METRIC RATING
170th/ 347
METRIC RANK
$61,066
MEDIAN MALE EARNINGS
99.8/ 100
METRIC RATING
61st/ 347
METRIC RANK
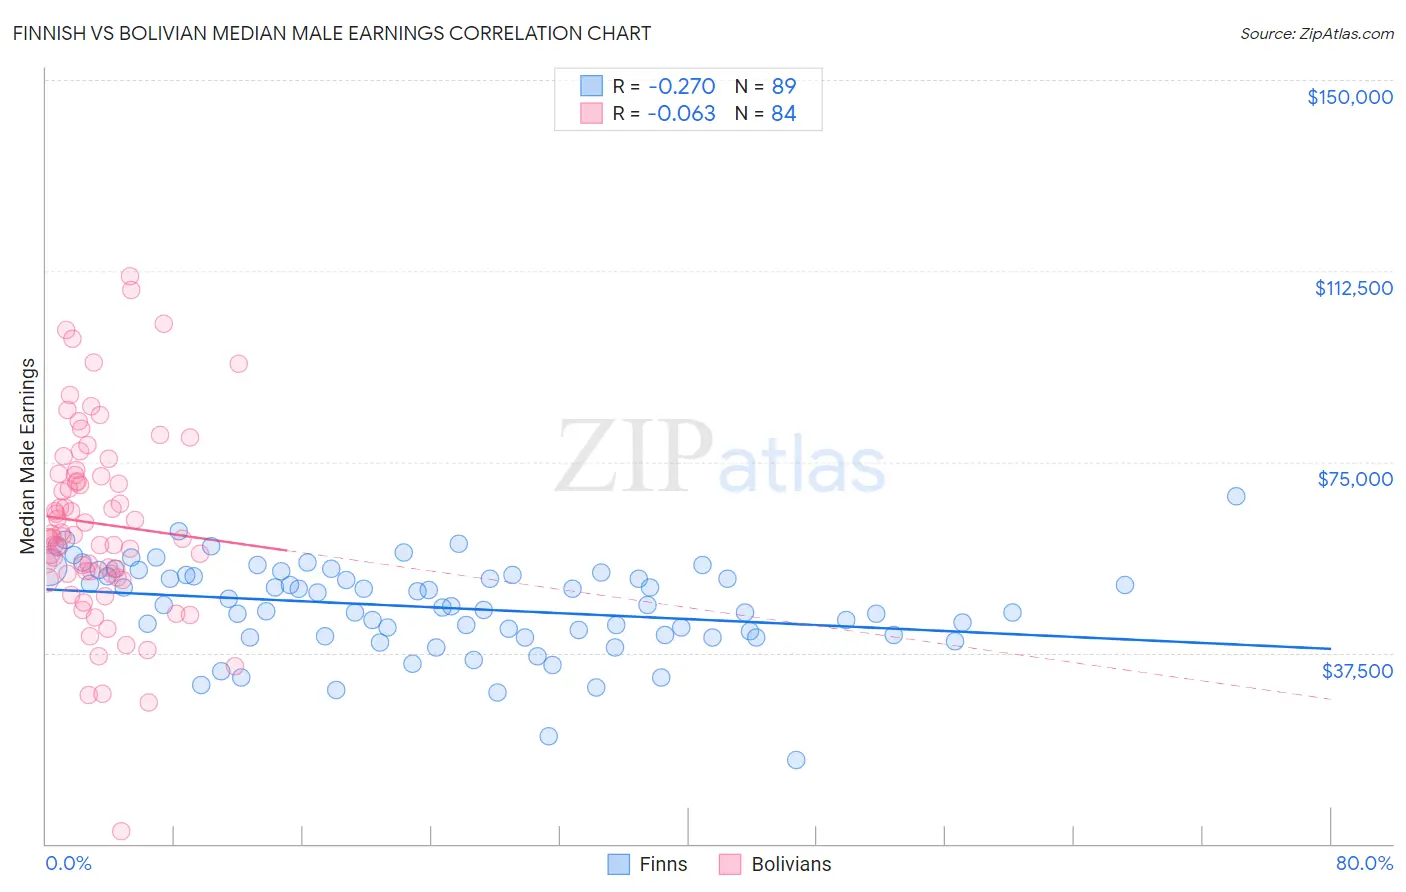
Finnish vs Bolivian Median Male Earnings Correlation Chart
The statistical analysis conducted on geographies consisting of 404,473,332 people shows a weak negative correlation between the proportion of Finns and median male earnings in the United States with a correlation coefficient (R) of -0.270 and weighted average of $54,721. Similarly, the statistical analysis conducted on geographies consisting of 184,669,287 people shows a slight negative correlation between the proportion of Bolivians and median male earnings in the United States with a correlation coefficient (R) of -0.063 and weighted average of $61,066, a difference of 11.6%.
Median Male Earnings Correlation Summary
| Measurement | Finnish | Bolivian |
| Minimum | $16,413 | $2,499 |
| Maximum | $68,250 | $111,480 |
| Range | $51,837 | $108,981 |
| Mean | $46,398 | $62,895 |
| Median | $46,792 | $60,590 |
| Interquartile 25% (IQ1) | $40,892 | $53,011 |
| Interquartile 75% (IQ3) | $52,786 | $72,615 |
| Interquartile Range (IQR) | $11,894 | $19,604 |
| Standard Deviation (Sample) | $8,951 | $18,921 |
| Standard Deviation (Population) | $8,900 | $18,808 |
Similar Demographics by Median Male Earnings
Demographics Similar to Finns by Median Male Earnings
In terms of median male earnings, the demographic groups most similar to Finns are French Canadian ($54,722, a difference of 0.0%), Immigrants from Peru ($54,695, a difference of 0.050%), Welsh ($54,647, a difference of 0.14%), Immigrants from Vietnam ($54,913, a difference of 0.35%), and South American Indian ($54,508, a difference of 0.39%).
| Demographics | Rating | Rank | Median Male Earnings |
| Ugandans | 68.6 /100 | #163 | Good $55,290 |
| Immigrants | South Eastern Asia | 67.6 /100 | #164 | Good $55,241 |
| Immigrants | Portugal | 66.3 /100 | #165 | Good $55,182 |
| Germans | 61.6 /100 | #166 | Good $54,974 |
| Immigrants | Fiji | 61.2 /100 | #167 | Good $54,958 |
| Immigrants | Vietnam | 60.2 /100 | #168 | Good $54,913 |
| French Canadians | 55.6 /100 | #169 | Average $54,722 |
| Finns | 55.6 /100 | #170 | Average $54,721 |
| Immigrants | Peru | 54.9 /100 | #171 | Average $54,695 |
| Welsh | 53.8 /100 | #172 | Average $54,647 |
| South American Indians | 50.4 /100 | #173 | Average $54,508 |
| South Americans | 50.0 /100 | #174 | Average $54,492 |
| Dutch | 48.0 /100 | #175 | Average $54,410 |
| Spaniards | 47.8 /100 | #176 | Average $54,401 |
| Costa Ricans | 44.8 /100 | #177 | Average $54,279 |
Demographics Similar to Bolivians by Median Male Earnings
In terms of median male earnings, the demographic groups most similar to Bolivians are Immigrants from Romania ($61,040, a difference of 0.040%), Immigrants from Netherlands ($61,096, a difference of 0.050%), Egyptian ($61,095, a difference of 0.050%), Immigrants from Pakistan ($60,987, a difference of 0.13%), and Immigrants from Eastern Europe ($60,958, a difference of 0.18%).
| Demographics | Rating | Rank | Median Male Earnings |
| Immigrants | Latvia | 99.9 /100 | #54 | Exceptional $61,422 |
| Greeks | 99.9 /100 | #55 | Exceptional $61,242 |
| Lithuanians | 99.9 /100 | #56 | Exceptional $61,228 |
| Immigrants | Scotland | 99.9 /100 | #57 | Exceptional $61,220 |
| New Zealanders | 99.9 /100 | #58 | Exceptional $61,199 |
| Immigrants | Netherlands | 99.8 /100 | #59 | Exceptional $61,096 |
| Egyptians | 99.8 /100 | #60 | Exceptional $61,095 |
| Bolivians | 99.8 /100 | #61 | Exceptional $61,066 |
| Immigrants | Romania | 99.8 /100 | #62 | Exceptional $61,040 |
| Immigrants | Pakistan | 99.8 /100 | #63 | Exceptional $60,987 |
| Immigrants | Eastern Europe | 99.8 /100 | #64 | Exceptional $60,958 |
| Immigrants | Indonesia | 99.8 /100 | #65 | Exceptional $60,935 |
| Immigrants | Croatia | 99.8 /100 | #66 | Exceptional $60,914 |
| Immigrants | Spain | 99.8 /100 | #67 | Exceptional $60,750 |
| Immigrants | Serbia | 99.7 /100 | #68 | Exceptional $60,600 |