Sierra Leonean vs Immigrants from Eritrea Median Male Earnings
COMPARE
Sierra Leonean
Immigrants from Eritrea
Median Male Earnings
Median Male Earnings Comparison
Sierra Leoneans
Immigrants from Eritrea
$54,279
MEDIAN MALE EARNINGS
44.8/ 100
METRIC RATING
178th/ 347
METRIC RANK
$53,715
MEDIAN MALE EARNINGS
31.8/ 100
METRIC RATING
187th/ 347
METRIC RANK
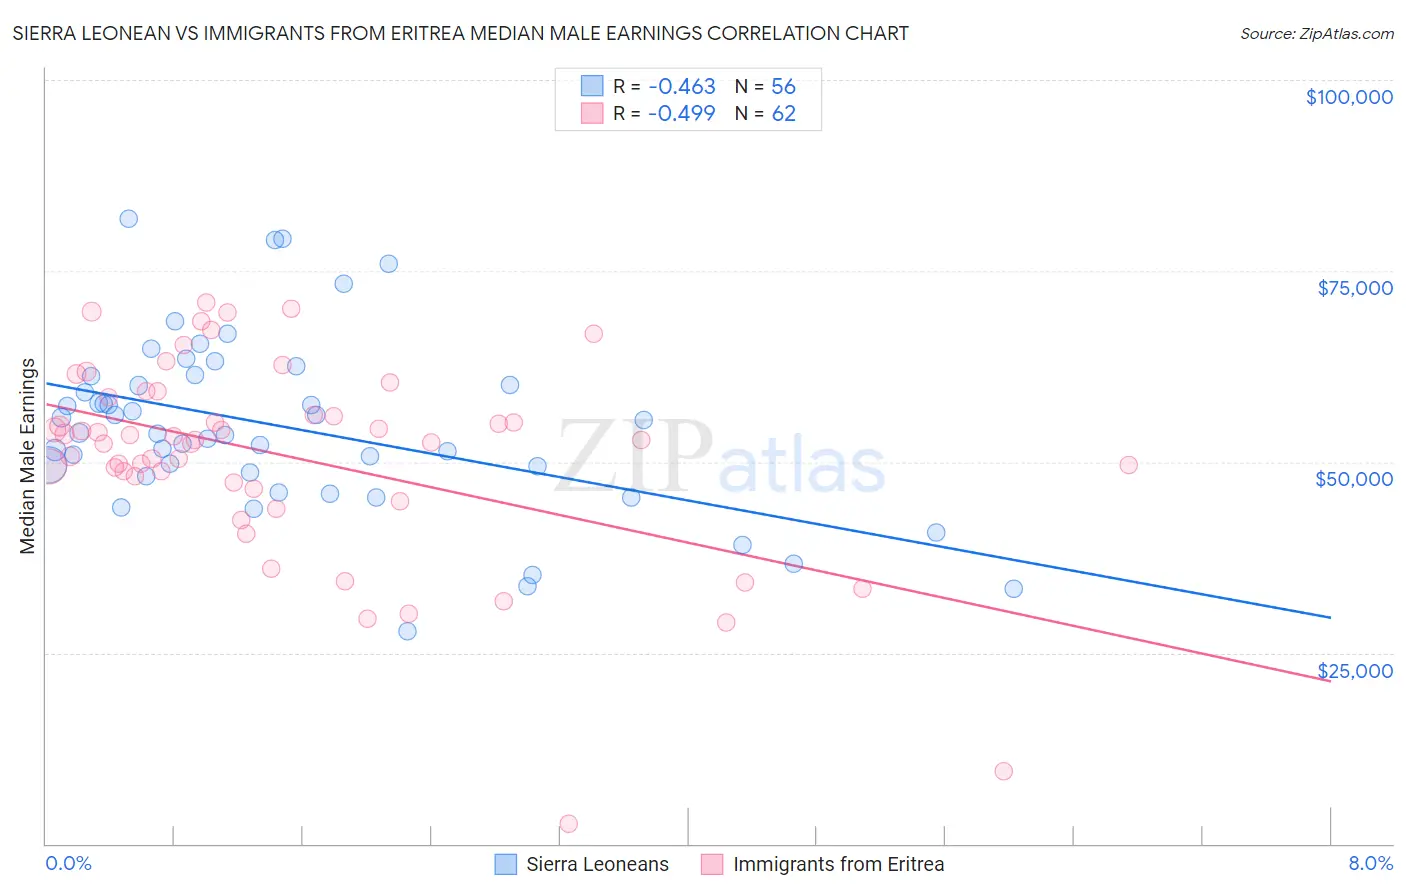
Sierra Leonean vs Immigrants from Eritrea Median Male Earnings Correlation Chart
The statistical analysis conducted on geographies consisting of 83,343,819 people shows a moderate negative correlation between the proportion of Sierra Leoneans and median male earnings in the United States with a correlation coefficient (R) of -0.463 and weighted average of $54,279. Similarly, the statistical analysis conducted on geographies consisting of 104,828,804 people shows a moderate negative correlation between the proportion of Immigrants from Eritrea and median male earnings in the United States with a correlation coefficient (R) of -0.499 and weighted average of $53,715, a difference of 1.1%.
Median Male Earnings Correlation Summary
| Measurement | Sierra Leonean | Immigrants from Eritrea |
| Minimum | $27,751 | $2,614 |
| Maximum | $81,874 | $70,824 |
| Range | $54,123 | $68,210 |
| Mean | $54,478 | $50,677 |
| Median | $53,788 | $52,865 |
| Interquartile 25% (IQ1) | $48,321 | $47,273 |
| Interquartile 75% (IQ3) | $60,630 | $58,480 |
| Interquartile Range (IQR) | $12,308 | $11,207 |
| Standard Deviation (Sample) | $11,493 | $13,241 |
| Standard Deviation (Population) | $11,390 | $13,134 |
Demographics Similar to Sierra Leoneans and Immigrants from Eritrea by Median Male Earnings
In terms of median male earnings, the demographic groups most similar to Sierra Leoneans are Costa Rican ($54,279, a difference of 0.0%), Celtic ($54,242, a difference of 0.070%), Iraqi ($54,182, a difference of 0.18%), Immigrants ($54,168, a difference of 0.21%), and Spaniard ($54,401, a difference of 0.22%). Similarly, the demographic groups most similar to Immigrants from Eritrea are Immigrants from Eastern Africa ($53,713, a difference of 0.0%), Puget Sound Salish ($53,704, a difference of 0.020%), Uruguayan ($53,680, a difference of 0.060%), Guamanian/Chamorro ($53,661, a difference of 0.10%), and Scotch-Irish ($53,658, a difference of 0.11%).
| Demographics | Rating | Rank | Median Male Earnings |
| Welsh | 53.8 /100 | #172 | Average $54,647 |
| South American Indians | 50.4 /100 | #173 | Average $54,508 |
| South Americans | 50.0 /100 | #174 | Average $54,492 |
| Dutch | 48.0 /100 | #175 | Average $54,410 |
| Spaniards | 47.8 /100 | #176 | Average $54,401 |
| Costa Ricans | 44.8 /100 | #177 | Average $54,279 |
| Sierra Leoneans | 44.8 /100 | #178 | Average $54,279 |
| Celtics | 43.9 /100 | #179 | Average $54,242 |
| Iraqis | 42.5 /100 | #180 | Average $54,182 |
| Immigrants | Immigrants | 42.1 /100 | #181 | Average $54,168 |
| Yugoslavians | 37.4 /100 | #182 | Fair $53,967 |
| Immigrants | South America | 37.3 /100 | #183 | Fair $53,962 |
| Whites/Caucasians | 36.5 /100 | #184 | Fair $53,925 |
| Immigrants | Sierra Leone | 36.0 /100 | #185 | Fair $53,905 |
| Colombians | 34.4 /100 | #186 | Fair $53,832 |
| Immigrants | Eritrea | 31.8 /100 | #187 | Fair $53,715 |
| Immigrants | Eastern Africa | 31.8 /100 | #188 | Fair $53,713 |
| Puget Sound Salish | 31.6 /100 | #189 | Fair $53,704 |
| Uruguayans | 31.1 /100 | #190 | Fair $53,680 |
| Guamanians/Chamorros | 30.7 /100 | #191 | Fair $53,661 |
| Scotch-Irish | 30.6 /100 | #192 | Fair $53,658 |