Ute vs Immigrants from Eritrea Median Male Earnings
COMPARE
Ute
Immigrants from Eritrea
Median Male Earnings
Median Male Earnings Comparison
Ute
Immigrants from Eritrea
$48,899
MEDIAN MALE EARNINGS
0.4/ 100
METRIC RATING
268th/ 347
METRIC RANK
$53,715
MEDIAN MALE EARNINGS
31.8/ 100
METRIC RATING
187th/ 347
METRIC RANK
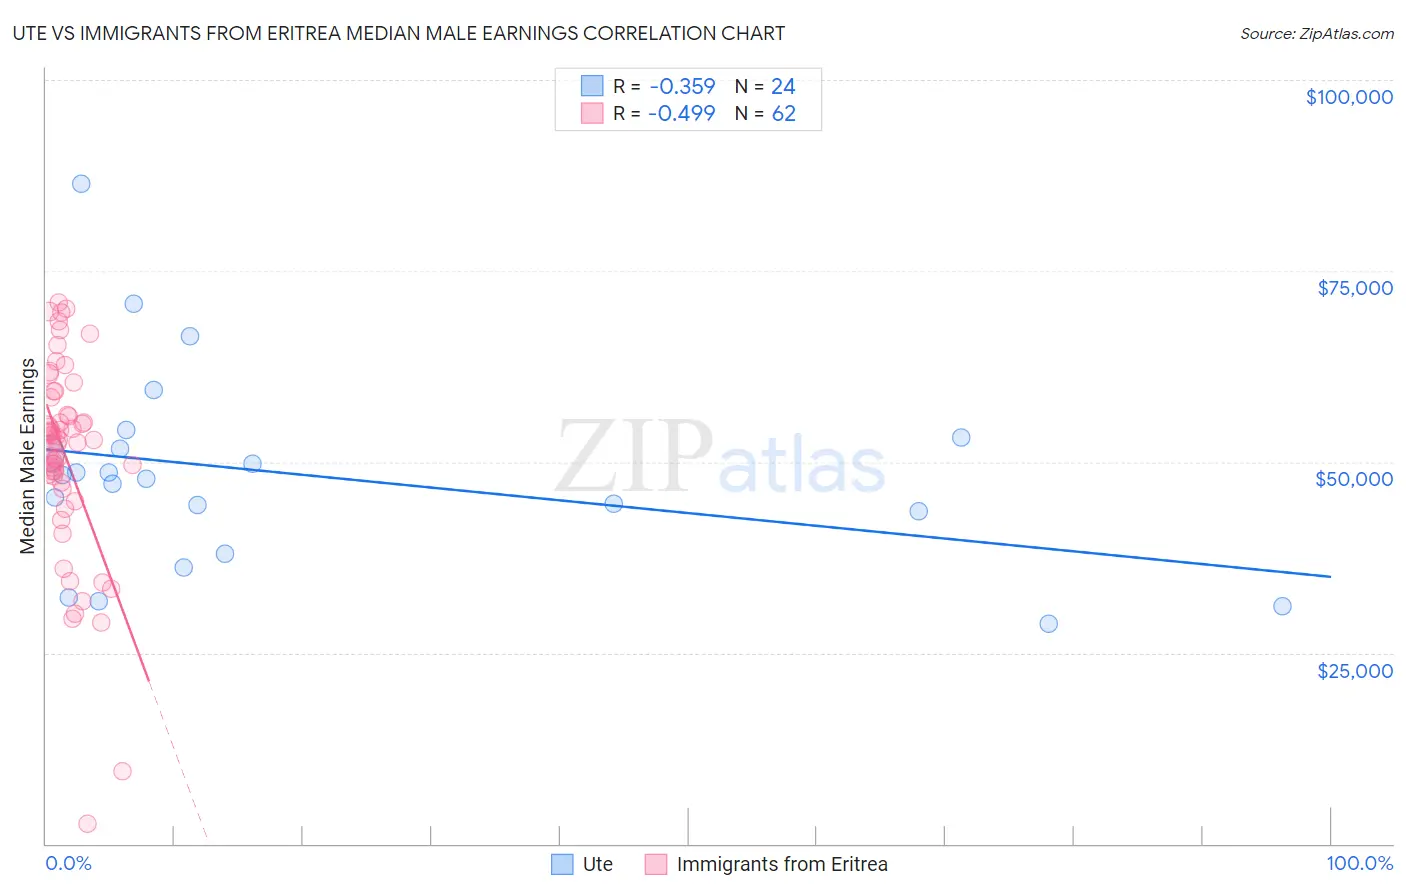
Ute vs Immigrants from Eritrea Median Male Earnings Correlation Chart
The statistical analysis conducted on geographies consisting of 55,657,801 people shows a mild negative correlation between the proportion of Ute and median male earnings in the United States with a correlation coefficient (R) of -0.359 and weighted average of $48,899. Similarly, the statistical analysis conducted on geographies consisting of 104,828,804 people shows a moderate negative correlation between the proportion of Immigrants from Eritrea and median male earnings in the United States with a correlation coefficient (R) of -0.499 and weighted average of $53,715, a difference of 9.9%.
Median Male Earnings Correlation Summary
| Measurement | Ute | Immigrants from Eritrea |
| Minimum | $28,875 | $2,614 |
| Maximum | $86,490 | $70,824 |
| Range | $57,615 | $68,210 |
| Mean | $48,301 | $50,677 |
| Median | $47,968 | $52,865 |
| Interquartile 25% (IQ1) | $40,774 | $47,273 |
| Interquartile 75% (IQ3) | $52,454 | $58,480 |
| Interquartile Range (IQR) | $11,681 | $11,207 |
| Standard Deviation (Sample) | $13,224 | $13,241 |
| Standard Deviation (Population) | $12,945 | $13,134 |
Similar Demographics by Median Male Earnings
Demographics Similar to Ute by Median Male Earnings
In terms of median male earnings, the demographic groups most similar to Ute are Tsimshian ($48,836, a difference of 0.13%), Spanish American ($49,008, a difference of 0.22%), Somali ($49,025, a difference of 0.26%), Potawatomi ($48,768, a difference of 0.27%), and Cherokee ($48,669, a difference of 0.47%).
| Demographics | Rating | Rank | Median Male Earnings |
| Liberians | 0.6 /100 | #261 | Tragic $49,318 |
| Immigrants | West Indies | 0.6 /100 | #262 | Tragic $49,271 |
| Nicaraguans | 0.6 /100 | #263 | Tragic $49,215 |
| Immigrants | Middle Africa | 0.6 /100 | #264 | Tragic $49,201 |
| Immigrants | Laos | 0.6 /100 | #265 | Tragic $49,190 |
| Somalis | 0.5 /100 | #266 | Tragic $49,025 |
| Spanish Americans | 0.5 /100 | #267 | Tragic $49,008 |
| Ute | 0.4 /100 | #268 | Tragic $48,899 |
| Tsimshian | 0.4 /100 | #269 | Tragic $48,836 |
| Potawatomi | 0.4 /100 | #270 | Tragic $48,768 |
| Cherokee | 0.3 /100 | #271 | Tragic $48,669 |
| Salvadorans | 0.3 /100 | #272 | Tragic $48,646 |
| Jamaicans | 0.3 /100 | #273 | Tragic $48,632 |
| Colville | 0.3 /100 | #274 | Tragic $48,516 |
| Immigrants | Somalia | 0.3 /100 | #275 | Tragic $48,439 |
Demographics Similar to Immigrants from Eritrea by Median Male Earnings
In terms of median male earnings, the demographic groups most similar to Immigrants from Eritrea are Immigrants from Eastern Africa ($53,713, a difference of 0.0%), Puget Sound Salish ($53,704, a difference of 0.020%), Uruguayan ($53,680, a difference of 0.060%), Guamanian/Chamorro ($53,661, a difference of 0.10%), and Scotch-Irish ($53,658, a difference of 0.11%).
| Demographics | Rating | Rank | Median Male Earnings |
| Iraqis | 42.5 /100 | #180 | Average $54,182 |
| Immigrants | Immigrants | 42.1 /100 | #181 | Average $54,168 |
| Yugoslavians | 37.4 /100 | #182 | Fair $53,967 |
| Immigrants | South America | 37.3 /100 | #183 | Fair $53,962 |
| Whites/Caucasians | 36.5 /100 | #184 | Fair $53,925 |
| Immigrants | Sierra Leone | 36.0 /100 | #185 | Fair $53,905 |
| Colombians | 34.4 /100 | #186 | Fair $53,832 |
| Immigrants | Eritrea | 31.8 /100 | #187 | Fair $53,715 |
| Immigrants | Eastern Africa | 31.8 /100 | #188 | Fair $53,713 |
| Puget Sound Salish | 31.6 /100 | #189 | Fair $53,704 |
| Uruguayans | 31.1 /100 | #190 | Fair $53,680 |
| Guamanians/Chamorros | 30.7 /100 | #191 | Fair $53,661 |
| Scotch-Irish | 30.6 /100 | #192 | Fair $53,658 |
| Kenyans | 30.4 /100 | #193 | Fair $53,647 |
| Spanish | 29.0 /100 | #194 | Fair $53,576 |