Chippewa vs Immigrants from Eritrea Median Male Earnings
COMPARE
Chippewa
Immigrants from Eritrea
Median Male Earnings
Median Male Earnings Comparison
Chippewa
Immigrants from Eritrea
$46,368
MEDIAN MALE EARNINGS
0.0/ 100
METRIC RATING
314th/ 347
METRIC RANK
$53,715
MEDIAN MALE EARNINGS
31.8/ 100
METRIC RATING
187th/ 347
METRIC RANK
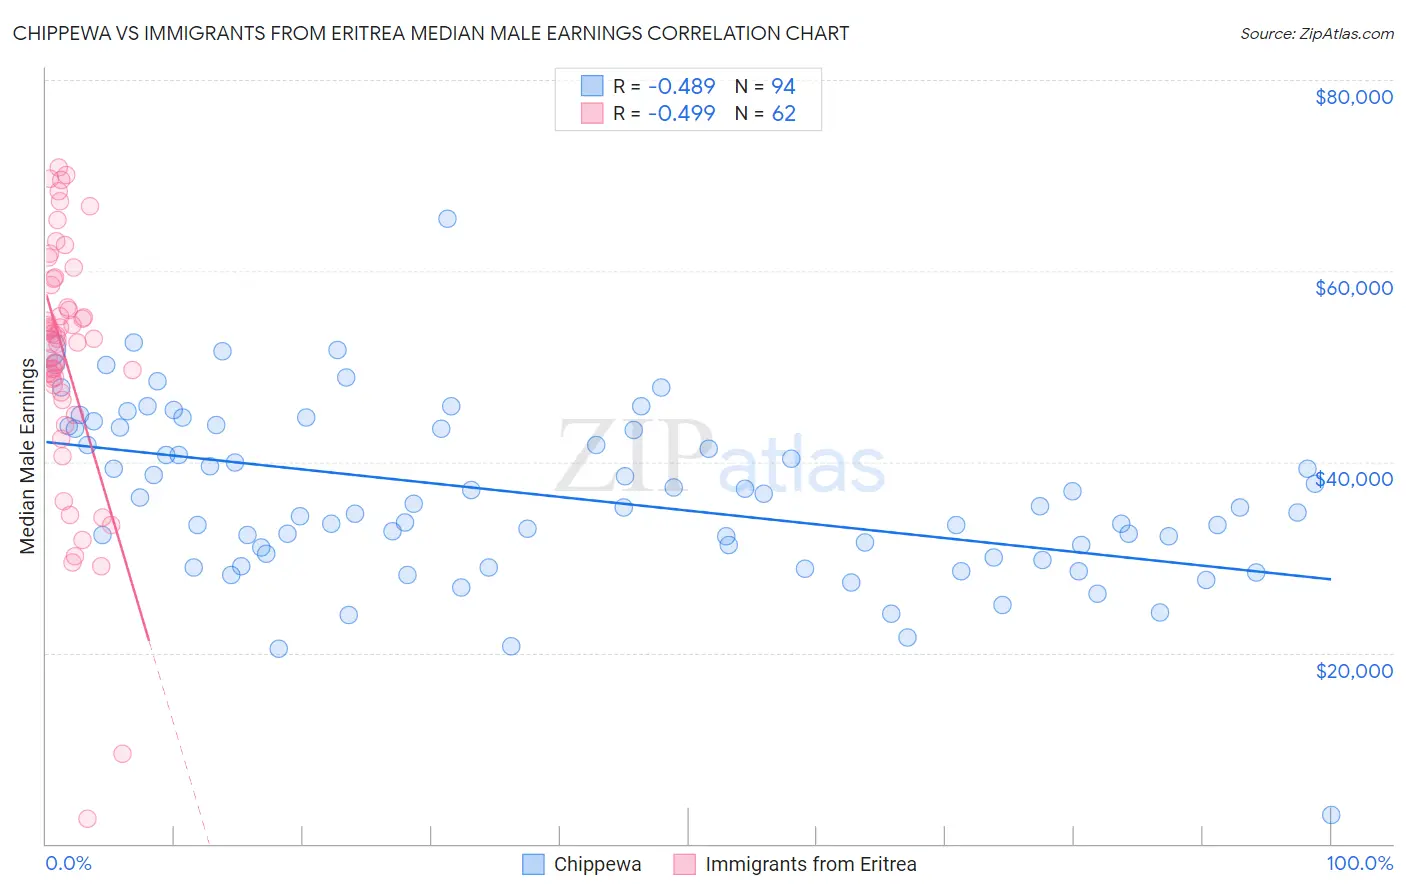
Chippewa vs Immigrants from Eritrea Median Male Earnings Correlation Chart
The statistical analysis conducted on geographies consisting of 215,007,267 people shows a moderate negative correlation between the proportion of Chippewa and median male earnings in the United States with a correlation coefficient (R) of -0.489 and weighted average of $46,368. Similarly, the statistical analysis conducted on geographies consisting of 104,828,804 people shows a moderate negative correlation between the proportion of Immigrants from Eritrea and median male earnings in the United States with a correlation coefficient (R) of -0.499 and weighted average of $53,715, a difference of 15.8%.
Median Male Earnings Correlation Summary
| Measurement | Chippewa | Immigrants from Eritrea |
| Minimum | $3,000 | $2,614 |
| Maximum | $65,417 | $70,824 |
| Range | $62,417 | $68,210 |
| Mean | $36,432 | $50,677 |
| Median | $35,290 | $52,865 |
| Interquartile 25% (IQ1) | $30,344 | $47,273 |
| Interquartile 75% (IQ3) | $43,504 | $58,480 |
| Interquartile Range (IQR) | $13,160 | $11,207 |
| Standard Deviation (Sample) | $9,091 | $13,241 |
| Standard Deviation (Population) | $9,042 | $13,134 |
Similar Demographics by Median Male Earnings
Demographics Similar to Chippewa by Median Male Earnings
In terms of median male earnings, the demographic groups most similar to Chippewa are Honduran ($46,374, a difference of 0.010%), Hispanic or Latino ($46,419, a difference of 0.11%), Apache ($46,429, a difference of 0.13%), Immigrants from Guatemala ($46,244, a difference of 0.27%), and Immigrants from Caribbean ($46,193, a difference of 0.38%).
| Demographics | Rating | Rank | Median Male Earnings |
| Immigrants | Dominican Republic | 0.0 /100 | #307 | Tragic $46,655 |
| Ottawa | 0.0 /100 | #308 | Tragic $46,611 |
| Creek | 0.0 /100 | #309 | Tragic $46,594 |
| Cubans | 0.0 /100 | #310 | Tragic $46,580 |
| Apache | 0.0 /100 | #311 | Tragic $46,429 |
| Hispanics or Latinos | 0.0 /100 | #312 | Tragic $46,419 |
| Hondurans | 0.0 /100 | #313 | Tragic $46,374 |
| Chippewa | 0.0 /100 | #314 | Tragic $46,368 |
| Immigrants | Guatemala | 0.0 /100 | #315 | Tragic $46,244 |
| Immigrants | Caribbean | 0.0 /100 | #316 | Tragic $46,193 |
| Mexicans | 0.0 /100 | #317 | Tragic $46,147 |
| Cheyenne | 0.0 /100 | #318 | Tragic $46,062 |
| Haitians | 0.0 /100 | #319 | Tragic $45,903 |
| Immigrants | Honduras | 0.0 /100 | #320 | Tragic $45,787 |
| Fijians | 0.0 /100 | #321 | Tragic $45,607 |
Demographics Similar to Immigrants from Eritrea by Median Male Earnings
In terms of median male earnings, the demographic groups most similar to Immigrants from Eritrea are Immigrants from Eastern Africa ($53,713, a difference of 0.0%), Puget Sound Salish ($53,704, a difference of 0.020%), Uruguayan ($53,680, a difference of 0.060%), Guamanian/Chamorro ($53,661, a difference of 0.10%), and Scotch-Irish ($53,658, a difference of 0.11%).
| Demographics | Rating | Rank | Median Male Earnings |
| Iraqis | 42.5 /100 | #180 | Average $54,182 |
| Immigrants | Immigrants | 42.1 /100 | #181 | Average $54,168 |
| Yugoslavians | 37.4 /100 | #182 | Fair $53,967 |
| Immigrants | South America | 37.3 /100 | #183 | Fair $53,962 |
| Whites/Caucasians | 36.5 /100 | #184 | Fair $53,925 |
| Immigrants | Sierra Leone | 36.0 /100 | #185 | Fair $53,905 |
| Colombians | 34.4 /100 | #186 | Fair $53,832 |
| Immigrants | Eritrea | 31.8 /100 | #187 | Fair $53,715 |
| Immigrants | Eastern Africa | 31.8 /100 | #188 | Fair $53,713 |
| Puget Sound Salish | 31.6 /100 | #189 | Fair $53,704 |
| Uruguayans | 31.1 /100 | #190 | Fair $53,680 |
| Guamanians/Chamorros | 30.7 /100 | #191 | Fair $53,661 |
| Scotch-Irish | 30.6 /100 | #192 | Fair $53,658 |
| Kenyans | 30.4 /100 | #193 | Fair $53,647 |
| Spanish | 29.0 /100 | #194 | Fair $53,576 |