Chinese vs Immigrants from Eritrea Median Male Earnings
COMPARE
Chinese
Immigrants from Eritrea
Median Male Earnings
Median Male Earnings Comparison
Chinese
Immigrants from Eritrea
$56,872
MEDIAN MALE EARNINGS
91.1/ 100
METRIC RATING
126th/ 347
METRIC RANK
$53,715
MEDIAN MALE EARNINGS
31.8/ 100
METRIC RATING
187th/ 347
METRIC RANK
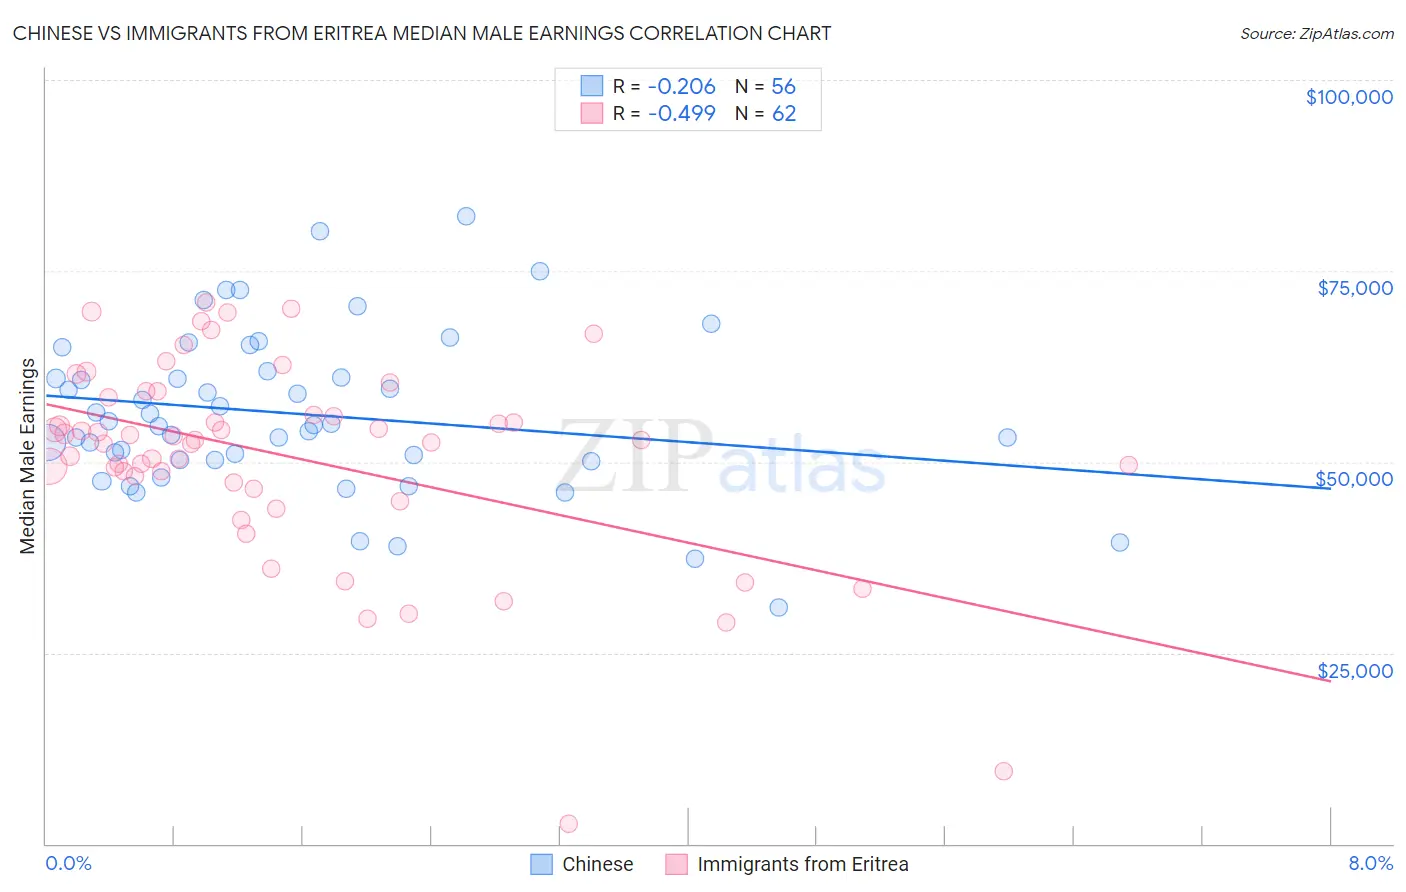
Chinese vs Immigrants from Eritrea Median Male Earnings Correlation Chart
The statistical analysis conducted on geographies consisting of 64,807,348 people shows a weak negative correlation between the proportion of Chinese and median male earnings in the United States with a correlation coefficient (R) of -0.206 and weighted average of $56,872. Similarly, the statistical analysis conducted on geographies consisting of 104,828,804 people shows a moderate negative correlation between the proportion of Immigrants from Eritrea and median male earnings in the United States with a correlation coefficient (R) of -0.499 and weighted average of $53,715, a difference of 5.9%.
Median Male Earnings Correlation Summary
| Measurement | Chinese | Immigrants from Eritrea |
| Minimum | $31,000 | $2,614 |
| Maximum | $82,197 | $70,824 |
| Range | $51,197 | $68,210 |
| Mean | $56,277 | $50,677 |
| Median | $54,905 | $52,865 |
| Interquartile 25% (IQ1) | $50,221 | $47,273 |
| Interquartile 75% (IQ3) | $61,384 | $58,480 |
| Interquartile Range (IQR) | $11,163 | $11,207 |
| Standard Deviation (Sample) | $10,489 | $13,241 |
| Standard Deviation (Population) | $10,395 | $13,134 |
Similar Demographics by Median Male Earnings
Demographics Similar to Chinese by Median Male Earnings
In terms of median male earnings, the demographic groups most similar to Chinese are Brazilian ($56,837, a difference of 0.060%), Immigrants from Syria ($56,830, a difference of 0.070%), Immigrants from Morocco ($56,958, a difference of 0.15%), Chilean ($56,973, a difference of 0.18%), and Pakistani ($56,719, a difference of 0.27%).
| Demographics | Rating | Rank | Median Male Earnings |
| Arabs | 94.0 /100 | #119 | Exceptional $57,298 |
| Canadians | 93.9 /100 | #120 | Exceptional $57,286 |
| Immigrants | Albania | 93.3 /100 | #121 | Exceptional $57,179 |
| Immigrants | Jordan | 93.1 /100 | #122 | Exceptional $57,145 |
| Slovenes | 93.1 /100 | #123 | Exceptional $57,145 |
| Chileans | 91.9 /100 | #124 | Exceptional $56,973 |
| Immigrants | Morocco | 91.8 /100 | #125 | Exceptional $56,958 |
| Chinese | 91.1 /100 | #126 | Exceptional $56,872 |
| Brazilians | 90.9 /100 | #127 | Exceptional $56,837 |
| Immigrants | Syria | 90.8 /100 | #128 | Exceptional $56,830 |
| Pakistanis | 89.9 /100 | #129 | Excellent $56,719 |
| Koreans | 89.4 /100 | #130 | Excellent $56,672 |
| Portuguese | 89.4 /100 | #131 | Excellent $56,663 |
| Czechs | 88.2 /100 | #132 | Excellent $56,546 |
| Immigrants | Germany | 88.2 /100 | #133 | Excellent $56,542 |
Demographics Similar to Immigrants from Eritrea by Median Male Earnings
In terms of median male earnings, the demographic groups most similar to Immigrants from Eritrea are Immigrants from Eastern Africa ($53,713, a difference of 0.0%), Puget Sound Salish ($53,704, a difference of 0.020%), Uruguayan ($53,680, a difference of 0.060%), Guamanian/Chamorro ($53,661, a difference of 0.10%), and Scotch-Irish ($53,658, a difference of 0.11%).
| Demographics | Rating | Rank | Median Male Earnings |
| Iraqis | 42.5 /100 | #180 | Average $54,182 |
| Immigrants | Immigrants | 42.1 /100 | #181 | Average $54,168 |
| Yugoslavians | 37.4 /100 | #182 | Fair $53,967 |
| Immigrants | South America | 37.3 /100 | #183 | Fair $53,962 |
| Whites/Caucasians | 36.5 /100 | #184 | Fair $53,925 |
| Immigrants | Sierra Leone | 36.0 /100 | #185 | Fair $53,905 |
| Colombians | 34.4 /100 | #186 | Fair $53,832 |
| Immigrants | Eritrea | 31.8 /100 | #187 | Fair $53,715 |
| Immigrants | Eastern Africa | 31.8 /100 | #188 | Fair $53,713 |
| Puget Sound Salish | 31.6 /100 | #189 | Fair $53,704 |
| Uruguayans | 31.1 /100 | #190 | Fair $53,680 |
| Guamanians/Chamorros | 30.7 /100 | #191 | Fair $53,661 |
| Scotch-Irish | 30.6 /100 | #192 | Fair $53,658 |
| Kenyans | 30.4 /100 | #193 | Fair $53,647 |
| Spanish | 29.0 /100 | #194 | Fair $53,576 |