Ethiopian vs Immigrants from Eritrea Median Male Earnings
COMPARE
Ethiopian
Immigrants from Eritrea
Median Male Earnings
Median Male Earnings Comparison
Ethiopians
Immigrants from Eritrea
$56,243
MEDIAN MALE EARNINGS
84.8/ 100
METRIC RATING
142nd/ 347
METRIC RANK
$53,715
MEDIAN MALE EARNINGS
31.8/ 100
METRIC RATING
187th/ 347
METRIC RANK
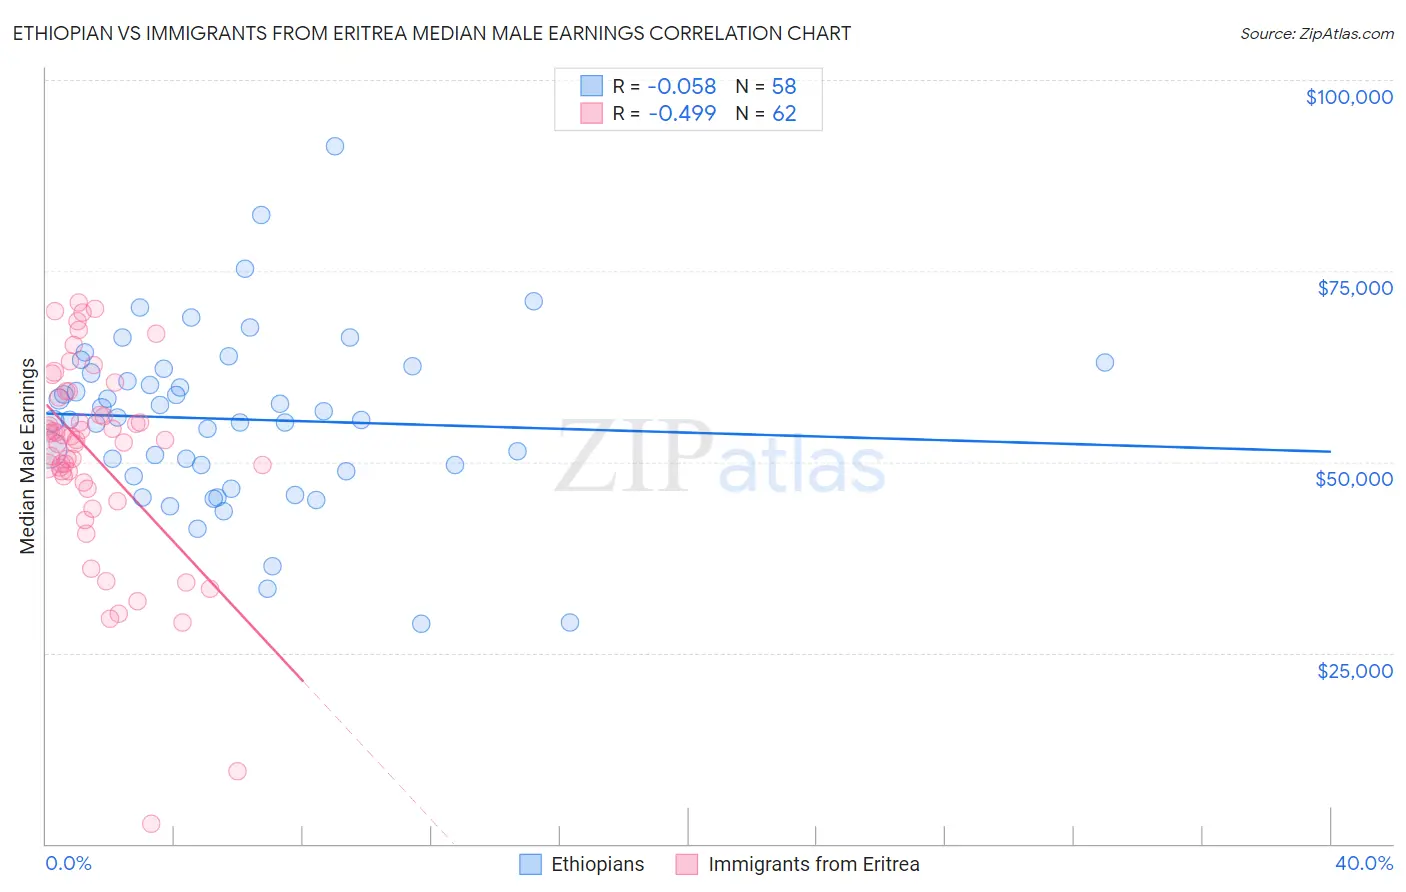
Ethiopian vs Immigrants from Eritrea Median Male Earnings Correlation Chart
The statistical analysis conducted on geographies consisting of 223,246,505 people shows a slight negative correlation between the proportion of Ethiopians and median male earnings in the United States with a correlation coefficient (R) of -0.058 and weighted average of $56,243. Similarly, the statistical analysis conducted on geographies consisting of 104,828,804 people shows a moderate negative correlation between the proportion of Immigrants from Eritrea and median male earnings in the United States with a correlation coefficient (R) of -0.499 and weighted average of $53,715, a difference of 4.7%.
Median Male Earnings Correlation Summary
| Measurement | Ethiopian | Immigrants from Eritrea |
| Minimum | $28,882 | $2,614 |
| Maximum | $91,333 | $70,824 |
| Range | $62,451 | $68,210 |
| Mean | $55,598 | $50,677 |
| Median | $55,634 | $52,865 |
| Interquartile 25% (IQ1) | $48,793 | $47,273 |
| Interquartile 75% (IQ3) | $62,132 | $58,480 |
| Interquartile Range (IQR) | $13,339 | $11,207 |
| Standard Deviation (Sample) | $11,505 | $13,241 |
| Standard Deviation (Population) | $11,405 | $13,134 |
Similar Demographics by Median Male Earnings
Demographics Similar to Ethiopians by Median Male Earnings
In terms of median male earnings, the demographic groups most similar to Ethiopians are Danish ($56,246, a difference of 0.0%), Zimbabwean ($56,302, a difference of 0.10%), Luxembourger ($56,300, a difference of 0.10%), Slovak ($56,306, a difference of 0.11%), and Sri Lankan ($56,136, a difference of 0.19%).
| Demographics | Rating | Rank | Median Male Earnings |
| Irish | 87.4 /100 | #135 | Excellent $56,464 |
| Immigrants | Saudi Arabia | 87.2 /100 | #136 | Excellent $56,452 |
| Slavs | 86.5 /100 | #137 | Excellent $56,390 |
| Slovaks | 85.5 /100 | #138 | Excellent $56,306 |
| Zimbabweans | 85.5 /100 | #139 | Excellent $56,302 |
| Luxembourgers | 85.5 /100 | #140 | Excellent $56,300 |
| Danes | 84.8 /100 | #141 | Excellent $56,246 |
| Ethiopians | 84.8 /100 | #142 | Excellent $56,243 |
| Sri Lankans | 83.4 /100 | #143 | Excellent $56,136 |
| Immigrants | Uganda | 82.4 /100 | #144 | Excellent $56,064 |
| Norwegians | 80.9 /100 | #145 | Excellent $55,965 |
| Immigrants | Chile | 80.7 /100 | #146 | Excellent $55,954 |
| Immigrants | Philippines | 78.4 /100 | #147 | Good $55,809 |
| Scottish | 78.2 /100 | #148 | Good $55,793 |
| English | 77.4 /100 | #149 | Good $55,747 |
Demographics Similar to Immigrants from Eritrea by Median Male Earnings
In terms of median male earnings, the demographic groups most similar to Immigrants from Eritrea are Immigrants from Eastern Africa ($53,713, a difference of 0.0%), Puget Sound Salish ($53,704, a difference of 0.020%), Uruguayan ($53,680, a difference of 0.060%), Guamanian/Chamorro ($53,661, a difference of 0.10%), and Scotch-Irish ($53,658, a difference of 0.11%).
| Demographics | Rating | Rank | Median Male Earnings |
| Iraqis | 42.5 /100 | #180 | Average $54,182 |
| Immigrants | Immigrants | 42.1 /100 | #181 | Average $54,168 |
| Yugoslavians | 37.4 /100 | #182 | Fair $53,967 |
| Immigrants | South America | 37.3 /100 | #183 | Fair $53,962 |
| Whites/Caucasians | 36.5 /100 | #184 | Fair $53,925 |
| Immigrants | Sierra Leone | 36.0 /100 | #185 | Fair $53,905 |
| Colombians | 34.4 /100 | #186 | Fair $53,832 |
| Immigrants | Eritrea | 31.8 /100 | #187 | Fair $53,715 |
| Immigrants | Eastern Africa | 31.8 /100 | #188 | Fair $53,713 |
| Puget Sound Salish | 31.6 /100 | #189 | Fair $53,704 |
| Uruguayans | 31.1 /100 | #190 | Fair $53,680 |
| Guamanians/Chamorros | 30.7 /100 | #191 | Fair $53,661 |
| Scotch-Irish | 30.6 /100 | #192 | Fair $53,658 |
| Kenyans | 30.4 /100 | #193 | Fair $53,647 |
| Spanish | 29.0 /100 | #194 | Fair $53,576 |