Finnish vs Immigrants from Eritrea Female Poverty Among 18-24 Year Olds
COMPARE
Finnish
Immigrants from Eritrea
Female Poverty Among 18-24 Year Olds
Female Poverty Among 18-24 Year Olds Comparison
Finns
Immigrants from Eritrea
20.8%
FEMALE POVERTY AMONG 18-24 YEAR OLDS
6.0/ 100
METRIC RATING
232nd/ 347
METRIC RANK
20.9%
FEMALE POVERTY AMONG 18-24 YEAR OLDS
4.2/ 100
METRIC RATING
241st/ 347
METRIC RANK
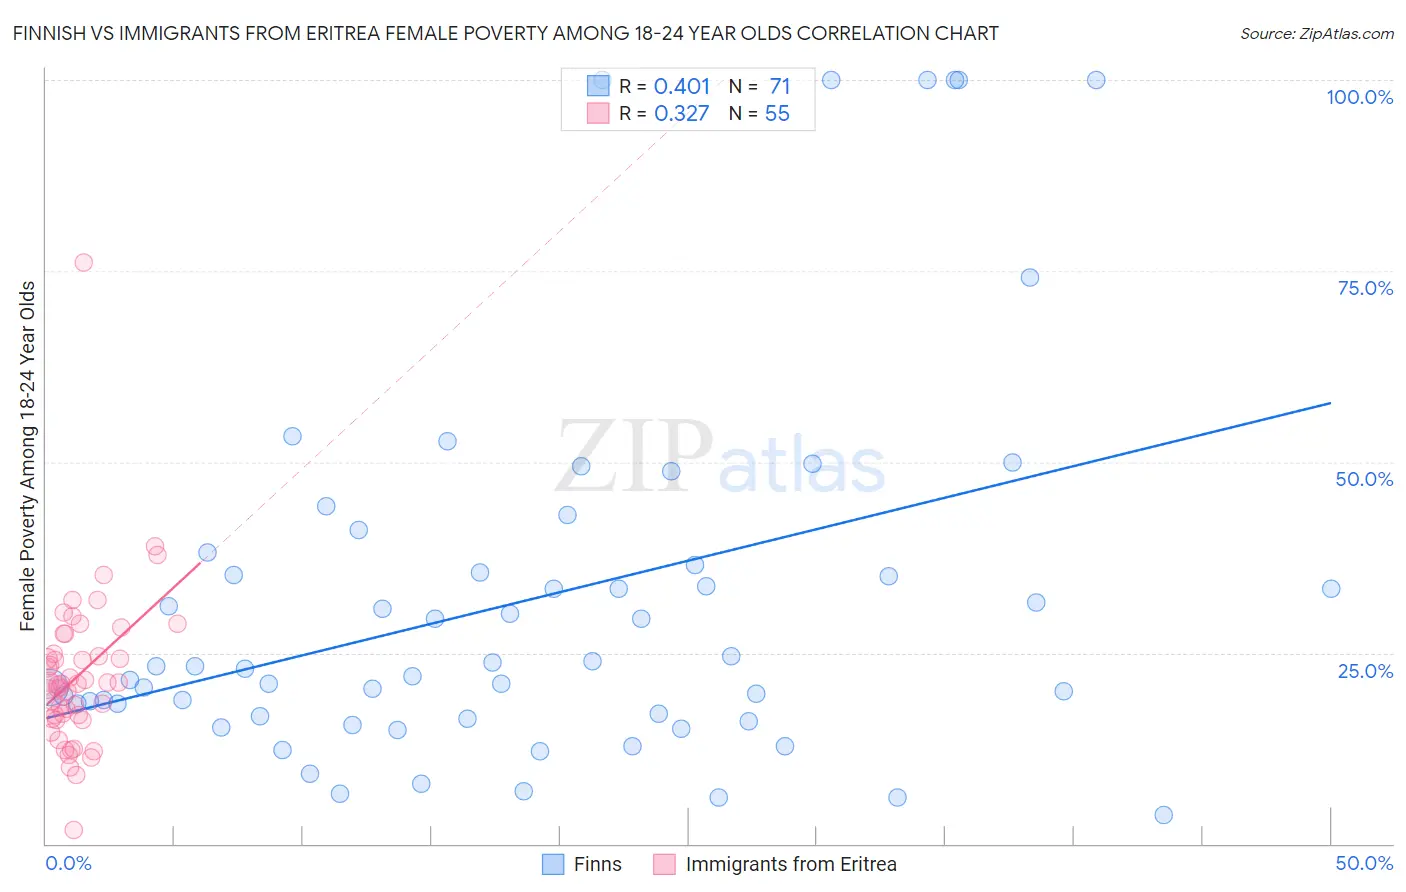
Finnish vs Immigrants from Eritrea Female Poverty Among 18-24 Year Olds Correlation Chart
The statistical analysis conducted on geographies consisting of 390,891,764 people shows a moderate positive correlation between the proportion of Finns and poverty level among females between the ages 18 and 24 in the United States with a correlation coefficient (R) of 0.401 and weighted average of 20.8%. Similarly, the statistical analysis conducted on geographies consisting of 104,465,492 people shows a mild positive correlation between the proportion of Immigrants from Eritrea and poverty level among females between the ages 18 and 24 in the United States with a correlation coefficient (R) of 0.327 and weighted average of 20.9%, a difference of 0.45%.
Female Poverty Among 18-24 Year Olds Correlation Summary
| Measurement | Finnish | Immigrants from Eritrea |
| Minimum | 3.8% | 1.8% |
| Maximum | 100.0% | 76.0% |
| Range | 96.2% | 74.2% |
| Mean | 31.9% | 21.9% |
| Median | 23.2% | 21.0% |
| Interquartile 25% (IQ1) | 16.7% | 16.4% |
| Interquartile 75% (IQ3) | 36.5% | 24.9% |
| Interquartile Range (IQR) | 19.8% | 8.5% |
| Standard Deviation (Sample) | 24.7% | 10.5% |
| Standard Deviation (Population) | 24.6% | 10.4% |
Demographics Similar to Finns and Immigrants from Eritrea by Female Poverty Among 18-24 Year Olds
In terms of female poverty among 18-24 year olds, the demographic groups most similar to Finns are Immigrants from St. Vincent and the Grenadines (20.8%, a difference of 0.0%), Australian (20.8%, a difference of 0.030%), White/Caucasian (20.8%, a difference of 0.030%), Immigrants from Denmark (20.8%, a difference of 0.030%), and Ghanaian (20.8%, a difference of 0.10%). Similarly, the demographic groups most similar to Immigrants from Eritrea are Israeli (20.9%, a difference of 0.010%), Luxembourger (20.9%, a difference of 0.020%), Immigrants from Guatemala (20.9%, a difference of 0.040%), Immigrants from Singapore (20.9%, a difference of 0.050%), and Scottish (20.9%, a difference of 0.090%).
| Demographics | Rating | Rank | Female Poverty Among 18-24 Year Olds |
| Estonians | 7.2 /100 | #226 | Tragic 20.7% |
| Immigrants | Sweden | 6.8 /100 | #227 | Tragic 20.7% |
| Ghanaians | 6.5 /100 | #228 | Tragic 20.8% |
| Australians | 6.1 /100 | #229 | Tragic 20.8% |
| Whites/Caucasians | 6.1 /100 | #230 | Tragic 20.8% |
| Immigrants | St. Vincent and the Grenadines | 6.0 /100 | #231 | Tragic 20.8% |
| Finns | 6.0 /100 | #232 | Tragic 20.8% |
| Immigrants | Denmark | 5.8 /100 | #233 | Tragic 20.8% |
| Welsh | 5.4 /100 | #234 | Tragic 20.8% |
| Immigrants | Uganda | 5.1 /100 | #235 | Tragic 20.8% |
| Okinawans | 4.9 /100 | #236 | Tragic 20.8% |
| Scottish | 4.5 /100 | #237 | Tragic 20.9% |
| Immigrants | Singapore | 4.4 /100 | #238 | Tragic 20.9% |
| Immigrants | Guatemala | 4.3 /100 | #239 | Tragic 20.9% |
| Luxembourgers | 4.2 /100 | #240 | Tragic 20.9% |
| Immigrants | Eritrea | 4.2 /100 | #241 | Tragic 20.9% |
| Israelis | 4.1 /100 | #242 | Tragic 20.9% |
| Marshallese | 3.4 /100 | #243 | Tragic 20.9% |
| Immigrants | Thailand | 3.4 /100 | #244 | Tragic 20.9% |
| Aleuts | 3.3 /100 | #245 | Tragic 20.9% |
| Immigrants | Australia | 3.1 /100 | #246 | Tragic 20.9% |