Cree vs Immigrants from Sudan Median Household Income
COMPARE
Cree
Immigrants from Sudan
Median Household Income
Median Household Income Comparison
Cree
Immigrants from Sudan
$74,685
MEDIAN HOUSEHOLD INCOME
0.1/ 100
METRIC RATING
283rd/ 347
METRIC RANK
$79,103
MEDIAN HOUSEHOLD INCOME
2.1/ 100
METRIC RATING
242nd/ 347
METRIC RANK
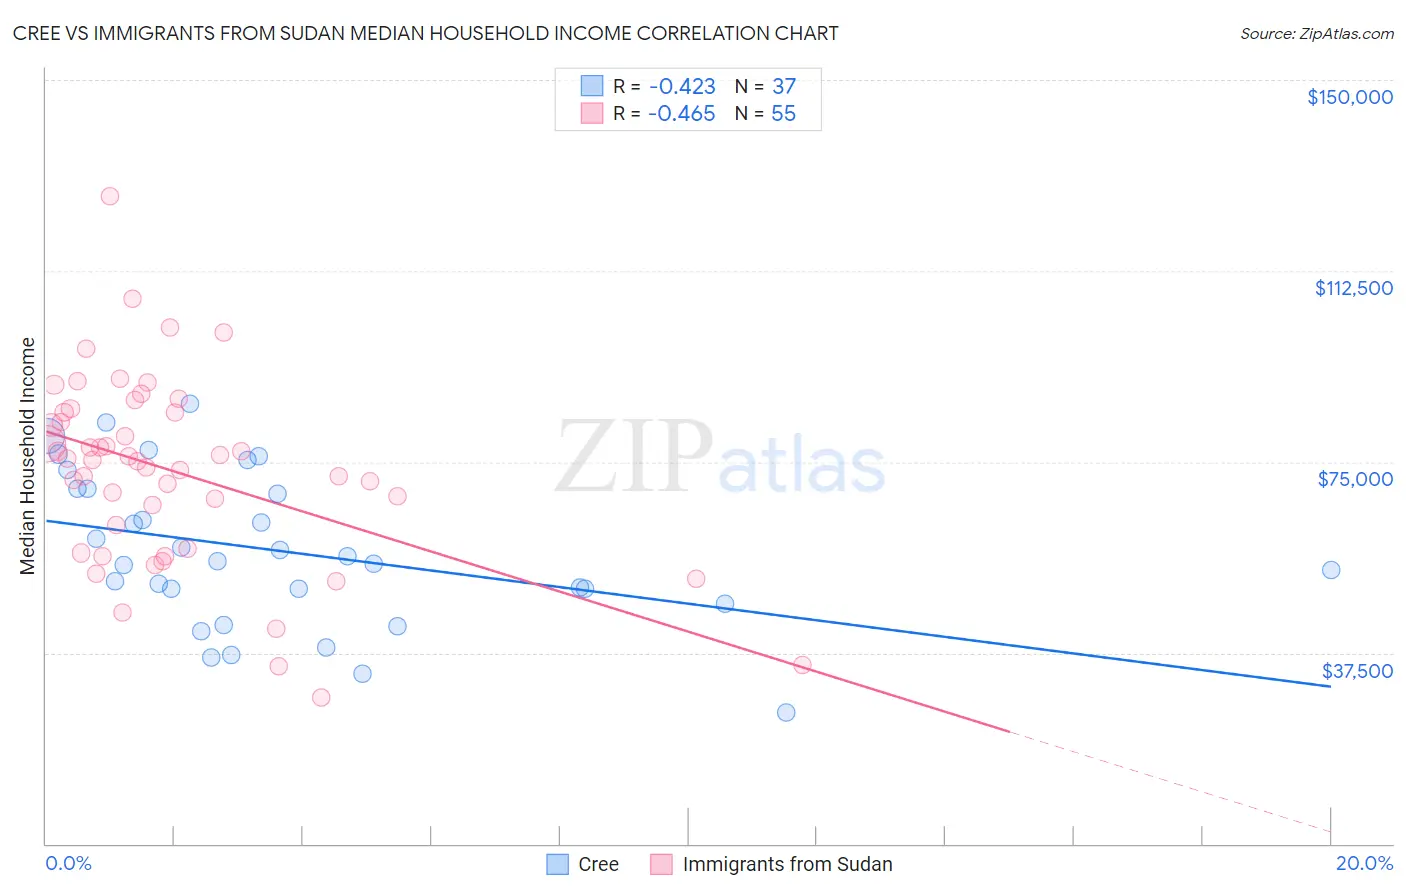
Cree vs Immigrants from Sudan Median Household Income Correlation Chart
The statistical analysis conducted on geographies consisting of 76,206,119 people shows a moderate negative correlation between the proportion of Cree and median household income in the United States with a correlation coefficient (R) of -0.423 and weighted average of $74,685. Similarly, the statistical analysis conducted on geographies consisting of 118,931,999 people shows a moderate negative correlation between the proportion of Immigrants from Sudan and median household income in the United States with a correlation coefficient (R) of -0.465 and weighted average of $79,103, a difference of 5.9%.
Median Household Income Correlation Summary
| Measurement | Cree | Immigrants from Sudan |
| Minimum | $25,833 | $28,750 |
| Maximum | $86,509 | $127,214 |
| Range | $60,676 | $98,464 |
| Mean | $57,468 | $73,170 |
| Median | $55,368 | $75,325 |
| Interquartile 25% (IQ1) | $48,609 | $58,025 |
| Interquartile 75% (IQ3) | $69,690 | $84,793 |
| Interquartile Range (IQR) | $21,081 | $26,769 |
| Standard Deviation (Sample) | $14,992 | $18,620 |
| Standard Deviation (Population) | $14,788 | $18,450 |
Similar Demographics by Median Household Income
Demographics Similar to Cree by Median Household Income
In terms of median household income, the demographic groups most similar to Cree are Yaqui ($74,596, a difference of 0.12%), Central American Indian ($74,847, a difference of 0.22%), Immigrants from Liberia ($74,896, a difference of 0.28%), Mexican ($74,399, a difference of 0.39%), and Senegalese ($74,999, a difference of 0.42%).
| Demographics | Rating | Rank | Median Household Income |
| Immigrants | Latin America | 0.2 /100 | #276 | Tragic $75,420 |
| Spanish Americans | 0.2 /100 | #277 | Tragic $75,386 |
| Osage | 0.2 /100 | #278 | Tragic $75,240 |
| Immigrants | Guatemala | 0.2 /100 | #279 | Tragic $75,123 |
| Senegalese | 0.2 /100 | #280 | Tragic $74,999 |
| Immigrants | Liberia | 0.1 /100 | #281 | Tragic $74,896 |
| Central American Indians | 0.1 /100 | #282 | Tragic $74,847 |
| Cree | 0.1 /100 | #283 | Tragic $74,685 |
| Yaqui | 0.1 /100 | #284 | Tragic $74,596 |
| Mexicans | 0.1 /100 | #285 | Tragic $74,399 |
| Immigrants | Somalia | 0.1 /100 | #286 | Tragic $74,300 |
| Iroquois | 0.1 /100 | #287 | Tragic $74,279 |
| Immigrants | Central America | 0.1 /100 | #288 | Tragic $74,217 |
| Fijians | 0.1 /100 | #289 | Tragic $74,205 |
| Bangladeshis | 0.1 /100 | #290 | Tragic $74,112 |
Demographics Similar to Immigrants from Sudan by Median Household Income
In terms of median household income, the demographic groups most similar to Immigrants from Sudan are Immigrants from Barbados ($78,989, a difference of 0.14%), Marshallese ($78,930, a difference of 0.22%), Inupiat ($78,841, a difference of 0.33%), Central American ($78,803, a difference of 0.38%), and Nonimmigrants ($79,429, a difference of 0.41%).
| Demographics | Rating | Rank | Median Household Income |
| Immigrants | Guyana | 4.5 /100 | #235 | Tragic $80,324 |
| Immigrants | Bosnia and Herzegovina | 3.4 /100 | #236 | Tragic $79,888 |
| Nicaraguans | 3.1 /100 | #237 | Tragic $79,737 |
| Barbadians | 3.0 /100 | #238 | Tragic $79,664 |
| Alaska Natives | 2.7 /100 | #239 | Tragic $79,509 |
| Immigrants | Western Africa | 2.7 /100 | #240 | Tragic $79,490 |
| Immigrants | Nonimmigrants | 2.6 /100 | #241 | Tragic $79,429 |
| Immigrants | Sudan | 2.1 /100 | #242 | Tragic $79,103 |
| Immigrants | Barbados | 1.9 /100 | #243 | Tragic $78,989 |
| Marshallese | 1.9 /100 | #244 | Tragic $78,930 |
| Inupiat | 1.8 /100 | #245 | Tragic $78,841 |
| Central Americans | 1.7 /100 | #246 | Tragic $78,803 |
| Immigrants | Burma/Myanmar | 1.6 /100 | #247 | Tragic $78,682 |
| Sudanese | 1.5 /100 | #248 | Tragic $78,529 |
| West Indians | 1.4 /100 | #249 | Tragic $78,455 |