Laotian vs Immigrants from Sudan Median Household Income
COMPARE
Laotian
Immigrants from Sudan
Median Household Income
Median Household Income Comparison
Laotians
Immigrants from Sudan
$94,990
MEDIAN HOUSEHOLD INCOME
99.8/ 100
METRIC RATING
61st/ 347
METRIC RANK
$79,103
MEDIAN HOUSEHOLD INCOME
2.1/ 100
METRIC RATING
242nd/ 347
METRIC RANK
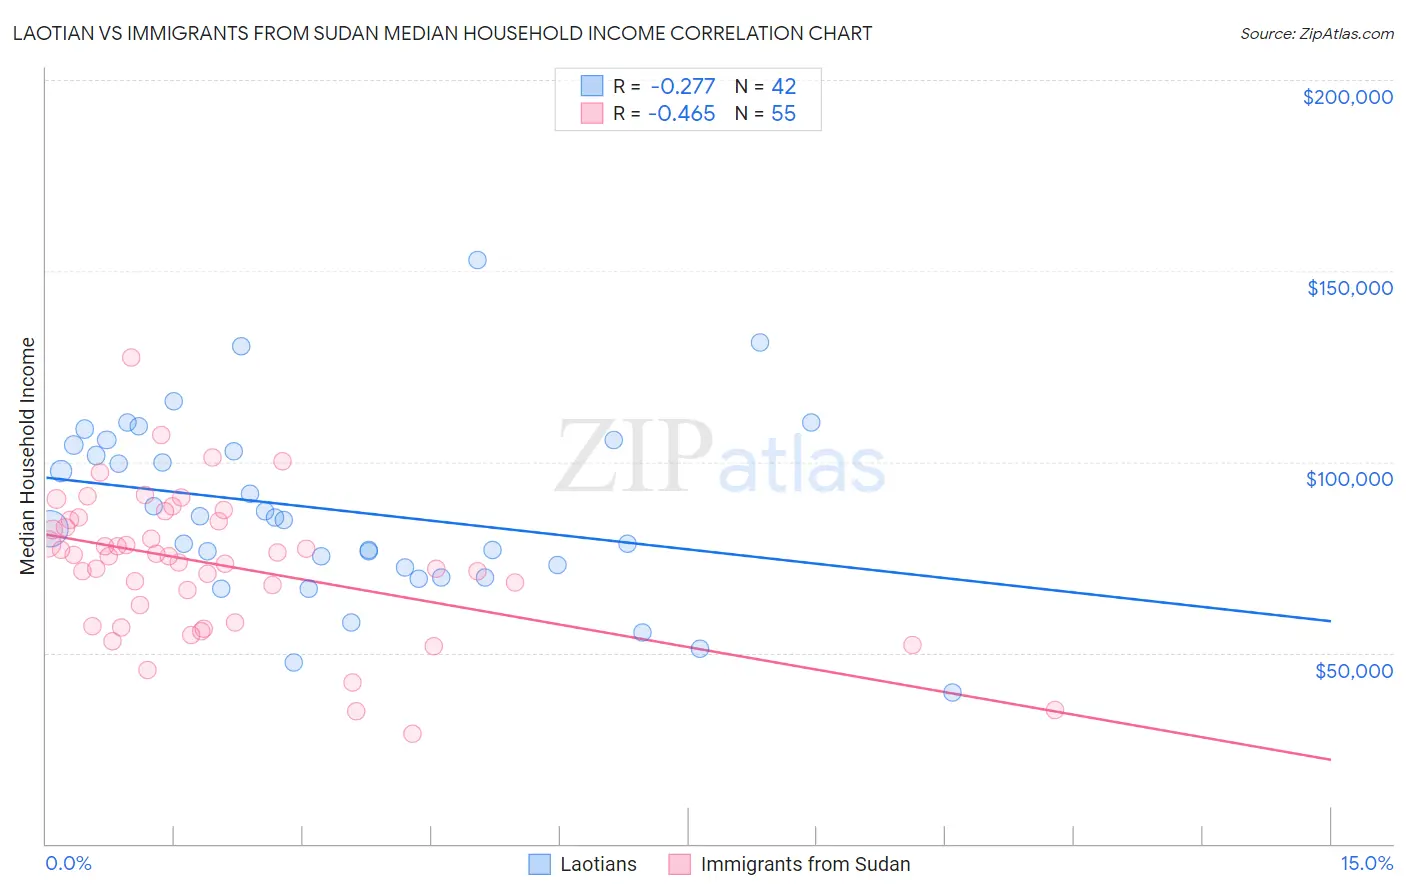
Laotian vs Immigrants from Sudan Median Household Income Correlation Chart
The statistical analysis conducted on geographies consisting of 224,713,642 people shows a weak negative correlation between the proportion of Laotians and median household income in the United States with a correlation coefficient (R) of -0.277 and weighted average of $94,990. Similarly, the statistical analysis conducted on geographies consisting of 118,931,999 people shows a moderate negative correlation between the proportion of Immigrants from Sudan and median household income in the United States with a correlation coefficient (R) of -0.465 and weighted average of $79,103, a difference of 20.1%.
Median Household Income Correlation Summary
| Measurement | Laotian | Immigrants from Sudan |
| Minimum | $39,542 | $28,750 |
| Maximum | $153,021 | $127,214 |
| Range | $113,479 | $98,464 |
| Mean | $87,400 | $73,170 |
| Median | $85,171 | $75,325 |
| Interquartile 25% (IQ1) | $72,352 | $58,025 |
| Interquartile 75% (IQ3) | $104,389 | $84,793 |
| Interquartile Range (IQR) | $32,037 | $26,769 |
| Standard Deviation (Sample) | $23,584 | $18,620 |
| Standard Deviation (Population) | $23,302 | $18,450 |
Similar Demographics by Median Household Income
Demographics Similar to Laotians by Median Household Income
In terms of median household income, the demographic groups most similar to Laotians are Korean ($95,018, a difference of 0.030%), Immigrants from Europe ($95,032, a difference of 0.040%), Soviet Union ($95,098, a difference of 0.11%), Immigrants from Norway ($94,846, a difference of 0.15%), and New Zealander ($95,146, a difference of 0.16%).
| Demographics | Rating | Rank | Median Household Income |
| Egyptians | 99.9 /100 | #54 | Exceptional $95,673 |
| Immigrants | Czechoslovakia | 99.9 /100 | #55 | Exceptional $95,319 |
| Immigrants | Austria | 99.9 /100 | #56 | Exceptional $95,277 |
| New Zealanders | 99.8 /100 | #57 | Exceptional $95,146 |
| Soviet Union | 99.8 /100 | #58 | Exceptional $95,098 |
| Immigrants | Europe | 99.8 /100 | #59 | Exceptional $95,032 |
| Koreans | 99.8 /100 | #60 | Exceptional $95,018 |
| Laotians | 99.8 /100 | #61 | Exceptional $94,990 |
| Immigrants | Norway | 99.8 /100 | #62 | Exceptional $94,846 |
| Greeks | 99.8 /100 | #63 | Exceptional $94,735 |
| Immigrants | Netherlands | 99.7 /100 | #64 | Exceptional $94,411 |
| Immigrants | Belarus | 99.7 /100 | #65 | Exceptional $94,399 |
| Immigrants | Romania | 99.7 /100 | #66 | Exceptional $94,222 |
| Immigrants | Scotland | 99.7 /100 | #67 | Exceptional $94,091 |
| Mongolians | 99.7 /100 | #68 | Exceptional $93,971 |
Demographics Similar to Immigrants from Sudan by Median Household Income
In terms of median household income, the demographic groups most similar to Immigrants from Sudan are Immigrants from Barbados ($78,989, a difference of 0.14%), Marshallese ($78,930, a difference of 0.22%), Inupiat ($78,841, a difference of 0.33%), Central American ($78,803, a difference of 0.38%), and Nonimmigrants ($79,429, a difference of 0.41%).
| Demographics | Rating | Rank | Median Household Income |
| Immigrants | Guyana | 4.5 /100 | #235 | Tragic $80,324 |
| Immigrants | Bosnia and Herzegovina | 3.4 /100 | #236 | Tragic $79,888 |
| Nicaraguans | 3.1 /100 | #237 | Tragic $79,737 |
| Barbadians | 3.0 /100 | #238 | Tragic $79,664 |
| Alaska Natives | 2.7 /100 | #239 | Tragic $79,509 |
| Immigrants | Western Africa | 2.7 /100 | #240 | Tragic $79,490 |
| Immigrants | Nonimmigrants | 2.6 /100 | #241 | Tragic $79,429 |
| Immigrants | Sudan | 2.1 /100 | #242 | Tragic $79,103 |
| Immigrants | Barbados | 1.9 /100 | #243 | Tragic $78,989 |
| Marshallese | 1.9 /100 | #244 | Tragic $78,930 |
| Inupiat | 1.8 /100 | #245 | Tragic $78,841 |
| Central Americans | 1.7 /100 | #246 | Tragic $78,803 |
| Immigrants | Burma/Myanmar | 1.6 /100 | #247 | Tragic $78,682 |
| Sudanese | 1.5 /100 | #248 | Tragic $78,529 |
| West Indians | 1.4 /100 | #249 | Tragic $78,455 |