Afghan vs Immigrants from Sudan Median Household Income

COMPARE

Afghan
Race
Ancestry
AfghanAfricanAlaska NativeAlaskan AthabascanAlbanianAleutAlsatianAmericanApacheArabArapahoArgentineanArmenianAssyrian/Chaldean/SyriacAustralianAustrianBahamianBangladeshiBarbadianBasqueBelgianBelizeanBermudanBhutaneseBlackfeetBolivianBrazilianBritishBritish West IndianBulgarianBurmeseCajunCambodianCanadianCape VerdeanCarpatho RusynCelticCentral AmericanCentral American IndianCherokeeCheyenneChickasawChileanChineseChippewaChoctawColombianColvilleComancheCosta RicanCreeCreekCroatianCrowCubanCypriotCzechCzechoslovakianDanishDelawareDominicanDutchDutch West IndianEastern EuropeanEcuadorianEgyptianEnglishEstonianEthiopianEuropeanFijianFilipinoFinnishFrenchFrench American IndianFrench CanadianGermanGerman RussianGhanaianGreekGuamanian/ChamorroGuatemalanGuyaneseHaitianHmongHonduranHopiHoumaHungarianIcelanderIndian (Asian)IndonesianInupiatIranianIraqiIrishIroquoisIsraeliItalianJamaicanJapaneseJordanianKenyanKiowaKoreanLaotianLatvianLebaneseLiberianLithuanianLumbeeLuxembourgerMacedonianMalaysianMalteseMarshalleseMenomineeMexicanMexican American IndianMongolianMoroccanNative HawaiianNavajoNepaleseNew ZealanderNicaraguanNigerianNorthern EuropeanNorwegianOkinawanOsageOttawaPaiutePakistaniPalestinianPanamanianParaguayanPennsylvania GermanPeruvianPimaPolishPortuguesePotawatomiPuebloPuerto RicanPuget Sound SalishRomanianRussianSalvadoranSamoanScandinavianScotch-IrishScottishSeminoleSenegaleseSerbianShoshoneSierra LeoneanSiouxSlavicSlovakSloveneSomaliSouth AfricanSouth AmericanSouth American IndianSoviet UnionSpaniardSpanishSpanish AmericanSpanish American IndianSri LankanSubsaharan AfricanSudaneseSwedishSwissSyrianTaiwaneseThaiTlingit-HaidaTohono O'OdhamTonganTrinidadian and TobagonianTsimshianTurkishU.S. Virgin IslanderUgandanUkrainianUruguayanUteVenezuelanVietnameseWelshWest IndianYakamaYaquiYugoslavianYumanYup'ikZimbabwean
Immigration
NonimmigrantsImmigrantsAfghanistanAfricaAlbaniaArgentinaArmeniaAsiaAustraliaAustriaBahamasBangladeshBarbadosBelarusBelgiumBelizeBoliviaBosnia and HerzegovinaBrazilBulgariaBurma/MyanmarCabo VerdeCambodiaCameroonCanadaCaribbeanCentral AmericaChileChinaColombiaCongoCosta RicaCroatiaCubaCzechoslovakiaDenmarkDominicaDominican RepublicEastern AfricaEastern AsiaEastern EuropeEcuadorEgyptEl SalvadorEnglandEritreaEthiopiaEuropeFijiFranceGermanyGhanaGreeceGrenadaGuatemalaGuyanaHaitiHondurasHong KongHungaryIndiaIndonesiaIranIraqIrelandIsraelItalyJamaicaJapanJordanKazakhstanKenyaKoreaKuwaitLaosLatin AmericaLatviaLebanonLiberiaLithuaniaMalaysiaMexicoMicronesiaMiddle AfricaMoldovaMoroccoNepalNetherlandsNicaraguaNigeriaNorth AmericaNorth MacedoniaNorthern AfricaNorthern EuropeNorwayOceaniaPakistanPanamaPeruPhilippinesPolandPortugalRomaniaRussiaSaudi ArabiaScotlandSenegalSerbiaSierra LeoneSingaporeSomaliaSouth AfricaSouth AmericaSouth Central AsiaSouth Eastern AsiaSouthern EuropeSpainSri LankaSt. Vincent and the GrenadinesSwedenSwitzerlandSyriaTaiwanThailandTrinidad and TobagoTurkeyUgandaUkraineUruguayUzbekistanVenezuelaVietnamWest IndiesWestern AfricaWestern AsiaWestern EuropeYemenZaireZimbabweAzores
Immigrants from Sudan
Race
Ancestry
AfricanAlaska NativeAlaskan AthabascanAlbanianAleutAlsatianAmericanApacheArabArapahoArgentineanArmenianAssyrian/Chaldean/SyriacAustralianAustrianBahamianBangladeshiBarbadianBasqueBelgianBelizeanBermudanBhutaneseBlackfeetBolivianBrazilianBritishBritish West IndianBulgarianBurmeseCajunCambodianCanadianCape VerdeanCarpatho RusynCelticCentral AmericanCentral American IndianCherokeeCheyenneChickasawChileanChineseChippewaChoctawColombianColvilleComancheCosta RicanCreeCreekCroatianCrowCubanCypriotCzechCzechoslovakianDanishDelawareDominicanDutchDutch West IndianEastern EuropeanEcuadorianEgyptianEnglishEstonianEthiopianEuropeanFijianFilipinoFinnishFrenchFrench American IndianFrench CanadianGermanGerman RussianGhanaianGreekGuamanian/ChamorroGuatemalanGuyaneseHaitianHmongHonduranHopiHoumaHungarianIcelanderIndian (Asian)IndonesianInupiatIranianIraqiIrishIroquoisIsraeliItalianJamaicanJapaneseJordanianKenyanKiowaKoreanLaotianLatvianLebaneseLiberianLithuanianLumbeeLuxembourgerMacedonianMalaysianMalteseMarshalleseMenomineeMexicanMexican American IndianMongolianMoroccanNative HawaiianNavajoNepaleseNew ZealanderNicaraguanNigerianNorthern EuropeanNorwegianOkinawanOsageOttawaPaiutePakistaniPalestinianPanamanianParaguayanPennsylvania GermanPeruvianPimaPolishPortuguesePotawatomiPuebloPuerto RicanPuget Sound SalishRomanianRussianSalvadoranSamoanScandinavianScotch-IrishScottishSeminoleSenegaleseSerbianShoshoneSierra LeoneanSiouxSlavicSlovakSloveneSomaliSouth AfricanSouth AmericanSouth American IndianSoviet UnionSpaniardSpanishSpanish AmericanSpanish American IndianSri LankanSubsaharan AfricanSudaneseSwedishSwissSyrianTaiwaneseThaiTlingit-HaidaTohono O'OdhamTonganTrinidadian and TobagonianTsimshianTurkishU.S. Virgin IslanderUgandanUkrainianUruguayanUteVenezuelanVietnameseWelshWest IndianYakamaYaquiYugoslavianYumanYup'ikZimbabwean
Immigration
NonimmigrantsImmigrantsAfghanistanAfricaAlbaniaArgentinaArmeniaAsiaAustraliaAustriaBahamasBangladeshBarbadosBelarusBelgiumBelizeBoliviaBosnia and HerzegovinaBrazilBulgariaBurma/MyanmarCabo VerdeCambodiaCameroonCanadaCaribbeanCentral AmericaChileChinaColombiaCongoCosta RicaCroatiaCubaCzechoslovakiaDenmarkDominicaDominican RepublicEastern AfricaEastern AsiaEastern EuropeEcuadorEgyptEl SalvadorEnglandEritreaEthiopiaEuropeFijiFranceGermanyGhanaGreeceGrenadaGuatemalaGuyanaHaitiHondurasHong KongHungaryIndiaIndonesiaIranIraqIrelandIsraelItalyJamaicaJapanJordanKazakhstanKenyaKoreaKuwaitLaosLatin AmericaLatviaLebanonLiberiaLithuaniaMalaysiaMexicoMicronesiaMiddle AfricaMoldovaMoroccoNepalNetherlandsNicaraguaNigeriaNorth AmericaNorth MacedoniaNorthern AfricaNorthern EuropeNorwayOceaniaPakistanPanamaPeruPhilippinesPolandPortugalRomaniaRussiaSaudi ArabiaScotlandSenegalSerbiaSierra LeoneSingaporeSomaliaSouth AfricaSouth AmericaSouth Central AsiaSouth Eastern AsiaSouthern EuropeSpainSri LankaSt. Vincent and the GrenadinesSudanSwedenSwitzerlandSyriaTaiwanThailandTrinidad and TobagoTurkeyUgandaUkraineUruguayUzbekistanVenezuelaVietnamWest IndiesWestern AfricaWestern AsiaWestern EuropeYemenZaireZimbabweAzores
Median Household Income
Income
Poverty
Unemployment
Labor Participation
Family Structure
Vehicle Availability
Education Level
Disability

Median Household Income Comparison

Afghans

Immigrants from Sudan

Exceptional
Tragic
$97,026
MEDIAN HOUSEHOLD INCOME
100.0/ 100
METRIC RATING
39th/ 347
METRIC RANK
$79,103
MEDIAN HOUSEHOLD INCOME
2.1/ 100
METRIC RATING
242nd/ 347
METRIC RANK

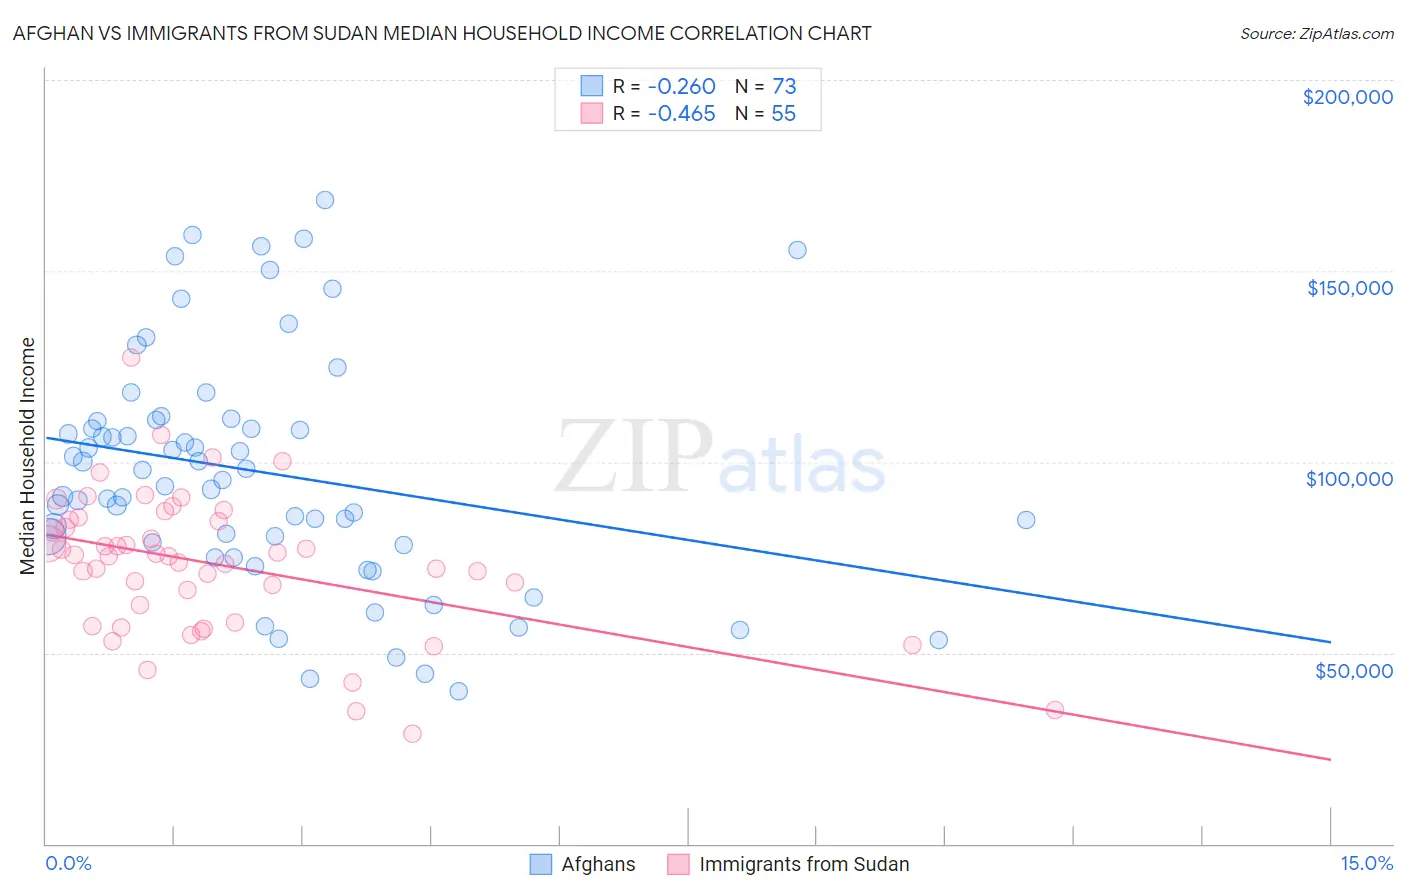
Afghan vs Immigrants from Sudan Median Household Income Correlation Chart

The statistical analysis conducted on geographies consisting of 148,820,759 people shows a weak negative correlation between the proportion of Afghans and median household income in the United States with a correlation coefficient (R) of -0.260 and weighted average of $97,026. Similarly, the statistical analysis conducted on geographies consisting of 118,931,999 people shows a moderate negative correlation between the proportion of Immigrants from Sudan and median household income in the United States with a correlation coefficient (R) of -0.465 and weighted average of $79,103, a difference of 22.7%.
Afghan vs Immigrants from Sudan Median Household Income

Median Household Income Correlation Summary

MeasurementAfghanImmigrants from Sudan
Minimum$40,069$28,750
Maximum$168,646$127,214
Range$128,577$98,464
Mean$97,284$73,170
Median$95,399$75,325
Interquartile 25% (IQ1)$78,550$58,025
Interquartile 75% (IQ3)$110,861$84,793
Interquartile Range (IQR)$32,311$26,769
Standard Deviation (Sample)$30,429$18,620
Standard Deviation (Population)$30,220$18,450

Similar Demographics by Median Household Income

Demographics Similar to Afghans by Median Household Income

In terms of median household income, the demographic groups most similar to Afghans are Maltese ($97,015, a difference of 0.010%), Immigrants from Turkey ($96,964, a difference of 0.060%), Immigrants from Lithuania ($96,836, a difference of 0.20%), Immigrants from Indonesia ($97,297, a difference of 0.28%), and Latvian ($97,311, a difference of 0.29%).
DemographicsRating | RankMedian Household Income
Immigrants | Denmark
100.0
/100
|
#32
Exceptional
$98,510
Chinese
100.0
/100
|
#33
Exceptional
$98,496
Russians
100.0
/100
|
#34
Exceptional
$98,008
Immigrants | Switzerland
100.0
/100
|
#35
Exceptional
$97,979
Immigrants | Pakistan
100.0
/100
|
#36
Exceptional
$97,528
Latvians
100.0
/100
|
#37
Exceptional
$97,311
Immigrants | Indonesia
100.0
/100
|
#38
Exceptional
$97,297
Afghans
100.0
/100
|
#39
Exceptional
$97,026
Maltese
100.0
/100
|
#40
Exceptional
$97,015
Immigrants | Turkey
100.0
/100
|
#41
Exceptional
$96,964
Immigrants | Lithuania
99.9
/100
|
#42
Exceptional
$96,836
Immigrants | France
99.9
/100
|
#43
Exceptional
$96,743
Immigrants | Greece
99.9
/100
|
#44
Exceptional
$96,675
Israelis
99.9
/100
|
#45
Exceptional
$96,552
Australians
99.9
/100
|
#46
Exceptional
$96,490

Demographics Similar to Immigrants from Sudan by Median Household Income

In terms of median household income, the demographic groups most similar to Immigrants from Sudan are Immigrants from Barbados ($78,989, a difference of 0.14%), Marshallese ($78,930, a difference of 0.22%), Inupiat ($78,841, a difference of 0.33%), Central American ($78,803, a difference of 0.38%), and Nonimmigrants ($79,429, a difference of 0.41%).
DemographicsRating | RankMedian Household Income
Immigrants | Guyana
4.5
/100
|
#235
Tragic
$80,324
Immigrants | Bosnia and Herzegovina
3.4
/100
|
#236
Tragic
$79,888
Nicaraguans
3.1
/100
|
#237
Tragic
$79,737
Barbadians
3.0
/100
|
#238
Tragic
$79,664
Alaska Natives
2.7
/100
|
#239
Tragic
$79,509
Immigrants | Western Africa
2.7
/100
|
#240
Tragic
$79,490
Immigrants | Nonimmigrants
2.6
/100
|
#241
Tragic
$79,429
Immigrants | Sudan
2.1
/100
|
#242
Tragic
$79,103
Immigrants | Barbados
1.9
/100
|
#243
Tragic
$78,989
Marshallese
1.9
/100
|
#244
Tragic
$78,930
Inupiat
1.8
/100
|
#245
Tragic
$78,841
Central Americans
1.7
/100
|
#246
Tragic
$78,803
Immigrants | Burma/Myanmar
1.6
/100
|
#247
Tragic
$78,682
Sudanese
1.5
/100
|
#248
Tragic
$78,529
West Indians
1.4
/100
|
#249
Tragic
$78,455