Ethiopian vs Immigrants from Sudan Male Unemployment
COMPARE
Ethiopian
Immigrants from Sudan
Male Unemployment
Male Unemployment Comparison
Ethiopians
Immigrants from Sudan
5.1%
MALE UNEMPLOYMENT
91.3/ 100
METRIC RATING
107th/ 347
METRIC RANK
5.0%
MALE UNEMPLOYMENT
96.5/ 100
METRIC RATING
76th/ 347
METRIC RANK
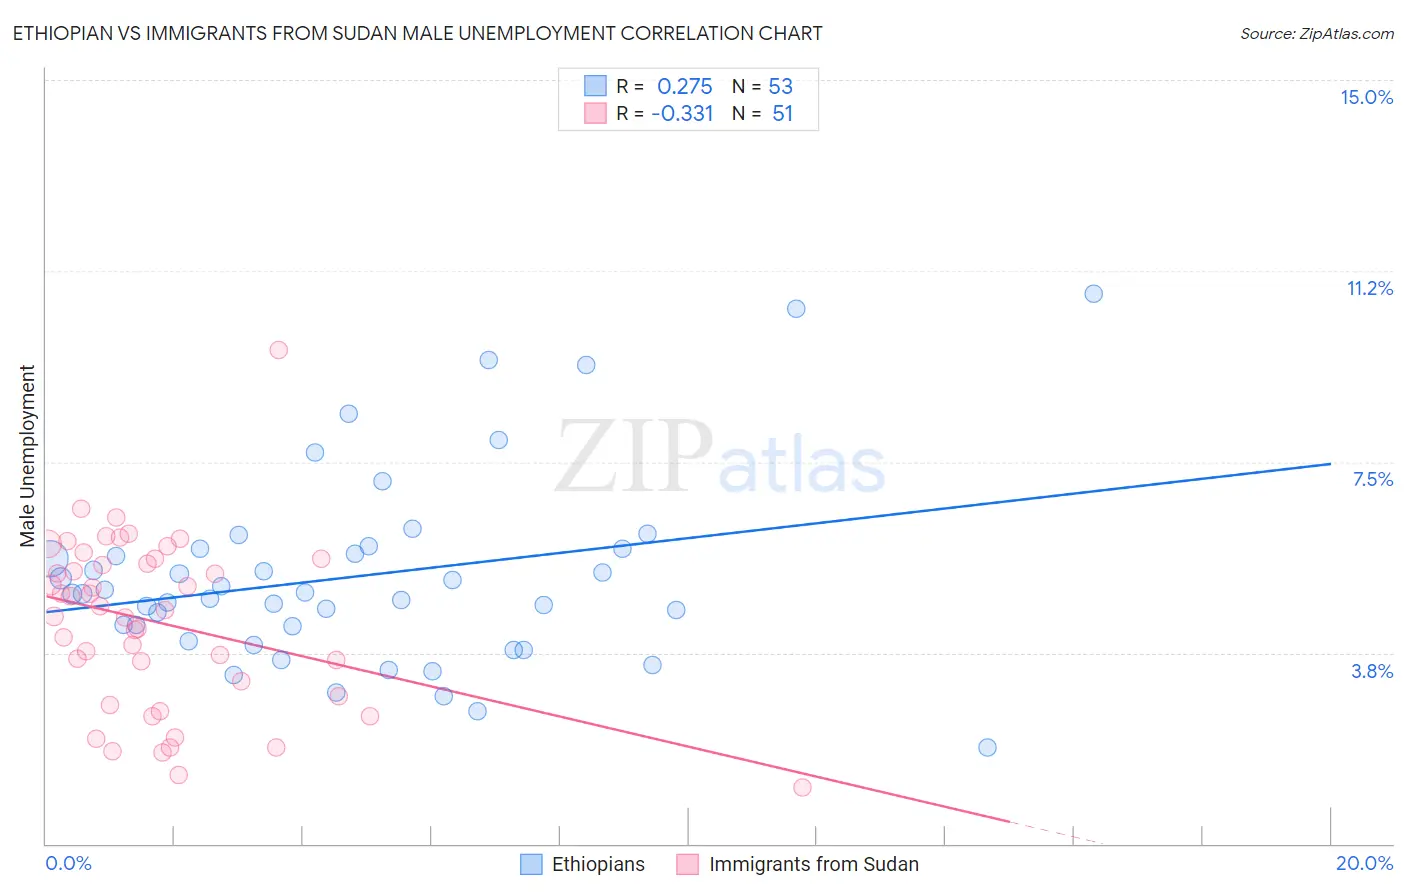
Ethiopian vs Immigrants from Sudan Male Unemployment Correlation Chart
The statistical analysis conducted on geographies consisting of 222,844,986 people shows a weak positive correlation between the proportion of Ethiopians and unemployment rate among males in the United States with a correlation coefficient (R) of 0.275 and weighted average of 5.1%. Similarly, the statistical analysis conducted on geographies consisting of 118,895,845 people shows a mild negative correlation between the proportion of Immigrants from Sudan and unemployment rate among males in the United States with a correlation coefficient (R) of -0.331 and weighted average of 5.0%, a difference of 1.5%.
Male Unemployment Correlation Summary
| Measurement | Ethiopian | Immigrants from Sudan |
| Minimum | 1.9% | 1.1% |
| Maximum | 10.8% | 9.7% |
| Range | 8.9% | 8.6% |
| Mean | 5.3% | 4.3% |
| Median | 4.9% | 4.6% |
| Interquartile 25% (IQ1) | 4.1% | 2.9% |
| Interquartile 75% (IQ3) | 5.8% | 5.6% |
| Interquartile Range (IQR) | 1.7% | 2.7% |
| Standard Deviation (Sample) | 1.9% | 1.7% |
| Standard Deviation (Population) | 1.9% | 1.7% |
Similar Demographics by Male Unemployment
Demographics Similar to Ethiopians by Male Unemployment
In terms of male unemployment, the demographic groups most similar to Ethiopians are Immigrants from Nicaragua (5.1%, a difference of 0.010%), Immigrants from Ethiopia (5.1%, a difference of 0.040%), Immigrants from Pakistan (5.1%, a difference of 0.070%), Immigrants from Czechoslovakia (5.1%, a difference of 0.080%), and Immigrants from Chile (5.1%, a difference of 0.090%).
| Demographics | Rating | Rank | Male Unemployment |
| Russians | 92.9 /100 | #100 | Exceptional 5.1% |
| German Russians | 92.7 /100 | #101 | Exceptional 5.1% |
| Immigrants | France | 92.7 /100 | #102 | Exceptional 5.1% |
| Immigrants | Jordan | 91.9 /100 | #103 | Exceptional 5.1% |
| Immigrants | Chile | 91.8 /100 | #104 | Exceptional 5.1% |
| Immigrants | Czechoslovakia | 91.7 /100 | #105 | Exceptional 5.1% |
| Immigrants | Ethiopia | 91.5 /100 | #106 | Exceptional 5.1% |
| Ethiopians | 91.3 /100 | #107 | Exceptional 5.1% |
| Immigrants | Nicaragua | 91.2 /100 | #108 | Exceptional 5.1% |
| Immigrants | Pakistan | 90.9 /100 | #109 | Exceptional 5.1% |
| Immigrants | England | 90.8 /100 | #110 | Exceptional 5.1% |
| Immigrants | Eastern Asia | 90.8 /100 | #111 | Exceptional 5.1% |
| Immigrants | Moldova | 90.3 /100 | #112 | Exceptional 5.1% |
| Immigrants | Austria | 90.3 /100 | #113 | Exceptional 5.1% |
| Romanians | 89.8 /100 | #114 | Excellent 5.1% |
Demographics Similar to Immigrants from Sudan by Male Unemployment
In terms of male unemployment, the demographic groups most similar to Immigrants from Sudan are Iranian (5.0%, a difference of 0.050%), Immigrants from Northern Europe (5.0%, a difference of 0.060%), South African (5.0%, a difference of 0.070%), Argentinean (5.0%, a difference of 0.12%), and French (5.0%, a difference of 0.13%).
| Demographics | Rating | Rank | Male Unemployment |
| Immigrants | Sweden | 97.4 /100 | #69 | Exceptional 5.0% |
| Whites/Caucasians | 97.3 /100 | #70 | Exceptional 5.0% |
| New Zealanders | 97.3 /100 | #71 | Exceptional 5.0% |
| Immigrants | South Africa | 97.1 /100 | #72 | Exceptional 5.0% |
| Greeks | 97.0 /100 | #73 | Exceptional 5.0% |
| Immigrants | North America | 96.9 /100 | #74 | Exceptional 5.0% |
| Assyrians/Chaldeans/Syriacs | 96.9 /100 | #75 | Exceptional 5.0% |
| Immigrants | Sudan | 96.5 /100 | #76 | Exceptional 5.0% |
| Iranians | 96.4 /100 | #77 | Exceptional 5.0% |
| Immigrants | Northern Europe | 96.4 /100 | #78 | Exceptional 5.0% |
| South Africans | 96.4 /100 | #79 | Exceptional 5.0% |
| Argentineans | 96.2 /100 | #80 | Exceptional 5.0% |
| French | 96.2 /100 | #81 | Exceptional 5.0% |
| Chileans | 96.2 /100 | #82 | Exceptional 5.0% |
| Immigrants | Eritrea | 96.0 /100 | #83 | Exceptional 5.0% |