Slovene vs Immigrants from Hong Kong Per Capita Income
COMPARE
Slovene
Immigrants from Hong Kong
Per Capita Income
Per Capita Income Comparison
Slovenes
Immigrants from Hong Kong
$45,581
PER CAPITA INCOME
89.6/ 100
METRIC RATING
134th/ 347
METRIC RANK
$56,709
PER CAPITA INCOME
100.0/ 100
METRIC RATING
8th/ 347
METRIC RANK
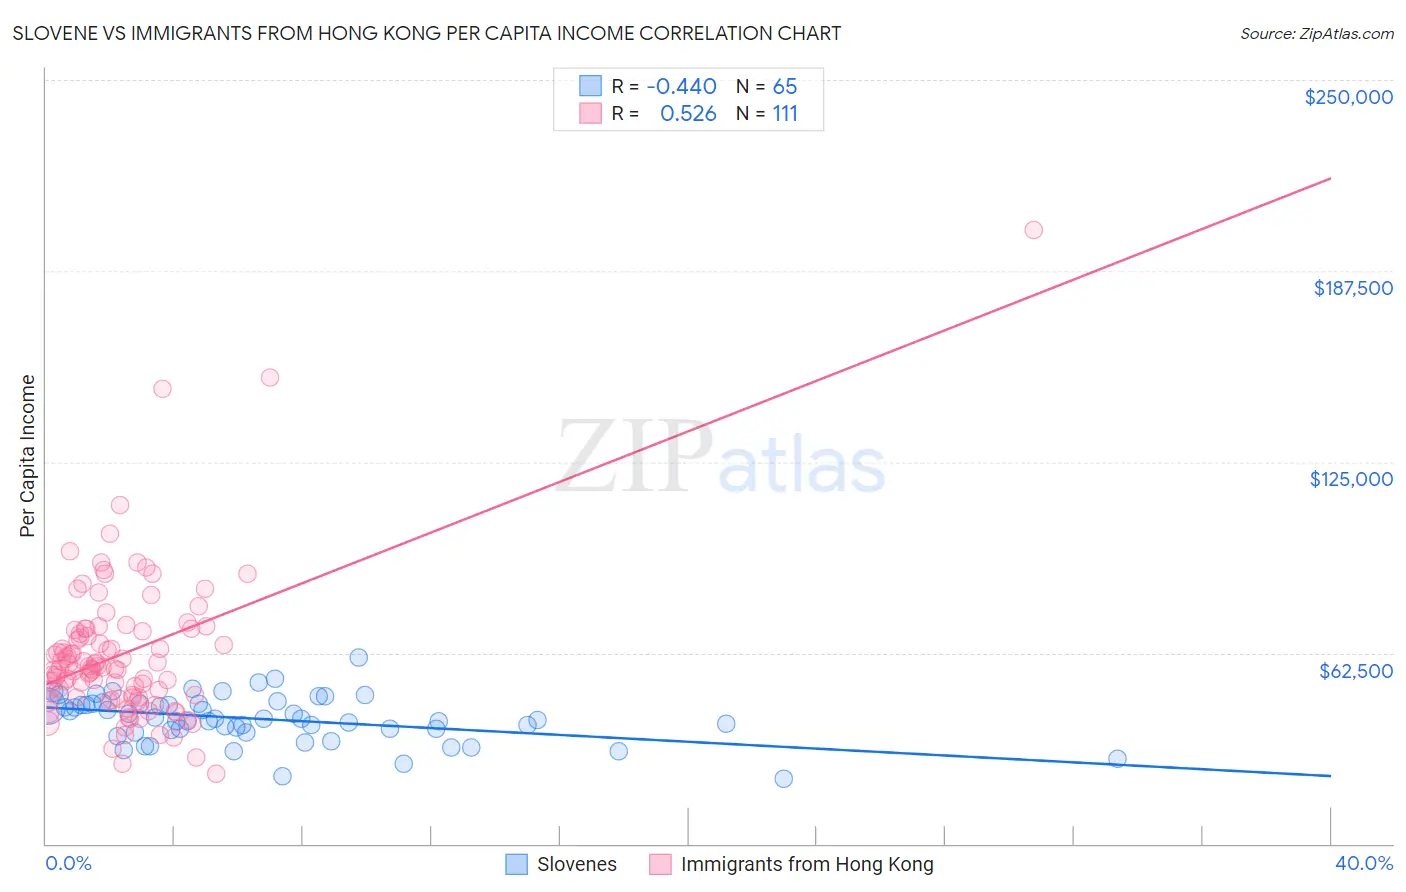
Slovene vs Immigrants from Hong Kong Per Capita Income Correlation Chart
The statistical analysis conducted on geographies consisting of 261,356,467 people shows a moderate negative correlation between the proportion of Slovenes and per capita income in the United States with a correlation coefficient (R) of -0.440 and weighted average of $45,581. Similarly, the statistical analysis conducted on geographies consisting of 253,979,312 people shows a substantial positive correlation between the proportion of Immigrants from Hong Kong and per capita income in the United States with a correlation coefficient (R) of 0.526 and weighted average of $56,709, a difference of 24.4%.
Per Capita Income Correlation Summary
| Measurement | Slovene | Immigrants from Hong Kong |
| Minimum | $21,418 | $23,001 |
| Maximum | $60,978 | $200,879 |
| Range | $39,560 | $177,878 |
| Mean | $40,788 | $62,312 |
| Median | $40,958 | $57,767 |
| Interquartile 25% (IQ1) | $36,844 | $47,777 |
| Interquartile 75% (IQ3) | $45,760 | $69,849 |
| Interquartile Range (IQR) | $8,915 | $22,072 |
| Standard Deviation (Sample) | $7,597 | $24,374 |
| Standard Deviation (Population) | $7,538 | $24,264 |
Similar Demographics by Per Capita Income
Demographics Similar to Slovenes by Per Capita Income
In terms of per capita income, the demographic groups most similar to Slovenes are Pakistani ($45,587, a difference of 0.010%), Jordanian ($45,605, a difference of 0.050%), Immigrants from North Macedonia ($45,622, a difference of 0.090%), Luxembourger ($45,663, a difference of 0.18%), and Arab ($45,662, a difference of 0.18%).
| Demographics | Rating | Rank | Per Capita Income |
| Immigrants | Germany | 91.3 /100 | #127 | Exceptional $45,751 |
| Swedes | 91.3 /100 | #128 | Exceptional $45,750 |
| Luxembourgers | 90.4 /100 | #129 | Exceptional $45,663 |
| Arabs | 90.4 /100 | #130 | Exceptional $45,662 |
| Immigrants | North Macedonia | 90.0 /100 | #131 | Exceptional $45,622 |
| Jordanians | 89.9 /100 | #132 | Excellent $45,605 |
| Pakistanis | 89.7 /100 | #133 | Excellent $45,587 |
| Slovenes | 89.6 /100 | #134 | Excellent $45,581 |
| Hungarians | 87.9 /100 | #135 | Excellent $45,426 |
| Immigrants | Oceania | 85.2 /100 | #136 | Excellent $45,220 |
| Immigrants | Syria | 85.2 /100 | #137 | Excellent $45,218 |
| Assyrians/Chaldeans/Syriacs | 84.8 /100 | #138 | Excellent $45,195 |
| Basques | 83.2 /100 | #139 | Excellent $45,086 |
| Immigrants | Jordan | 82.9 /100 | #140 | Excellent $45,066 |
| Slavs | 82.6 /100 | #141 | Excellent $45,049 |
Demographics Similar to Immigrants from Hong Kong by Per Capita Income
In terms of per capita income, the demographic groups most similar to Immigrants from Hong Kong are Immigrants from Ireland ($56,584, a difference of 0.22%), Immigrants from Israel ($57,384, a difference of 1.2%), Okinawan ($55,817, a difference of 1.6%), Eastern European ($55,780, a difference of 1.7%), and Immigrants from Taiwan ($57,742, a difference of 1.8%).
| Demographics | Rating | Rank | Per Capita Income |
| Filipinos | 100.0 /100 | #1 | Exceptional $59,066 |
| Iranians | 100.0 /100 | #2 | Exceptional $58,786 |
| Immigrants | Singapore | 100.0 /100 | #3 | Exceptional $58,353 |
| Immigrants | Australia | 100.0 /100 | #4 | Exceptional $57,953 |
| Immigrants | Iran | 100.0 /100 | #5 | Exceptional $57,759 |
| Immigrants | Taiwan | 100.0 /100 | #6 | Exceptional $57,742 |
| Immigrants | Israel | 100.0 /100 | #7 | Exceptional $57,384 |
| Immigrants | Hong Kong | 100.0 /100 | #8 | Exceptional $56,709 |
| Immigrants | Ireland | 100.0 /100 | #9 | Exceptional $56,584 |
| Okinawans | 100.0 /100 | #10 | Exceptional $55,817 |
| Eastern Europeans | 100.0 /100 | #11 | Exceptional $55,780 |
| Immigrants | Sweden | 100.0 /100 | #12 | Exceptional $55,582 |
| Immigrants | India | 100.0 /100 | #13 | Exceptional $55,268 |
| Immigrants | Belgium | 100.0 /100 | #14 | Exceptional $55,082 |
| Cypriots | 100.0 /100 | #15 | Exceptional $54,899 |