Danish vs Immigrants from Hong Kong Male Unemployment
COMPARE
Danish
Immigrants from Hong Kong
Male Unemployment
Male Unemployment Comparison
Danes
Immigrants from Hong Kong
4.5%
MALE UNEMPLOYMENT
100.0/ 100
METRIC RATING
5th/ 347
METRIC RANK
5.2%
MALE UNEMPLOYMENT
65.7/ 100
METRIC RATING
163rd/ 347
METRIC RANK
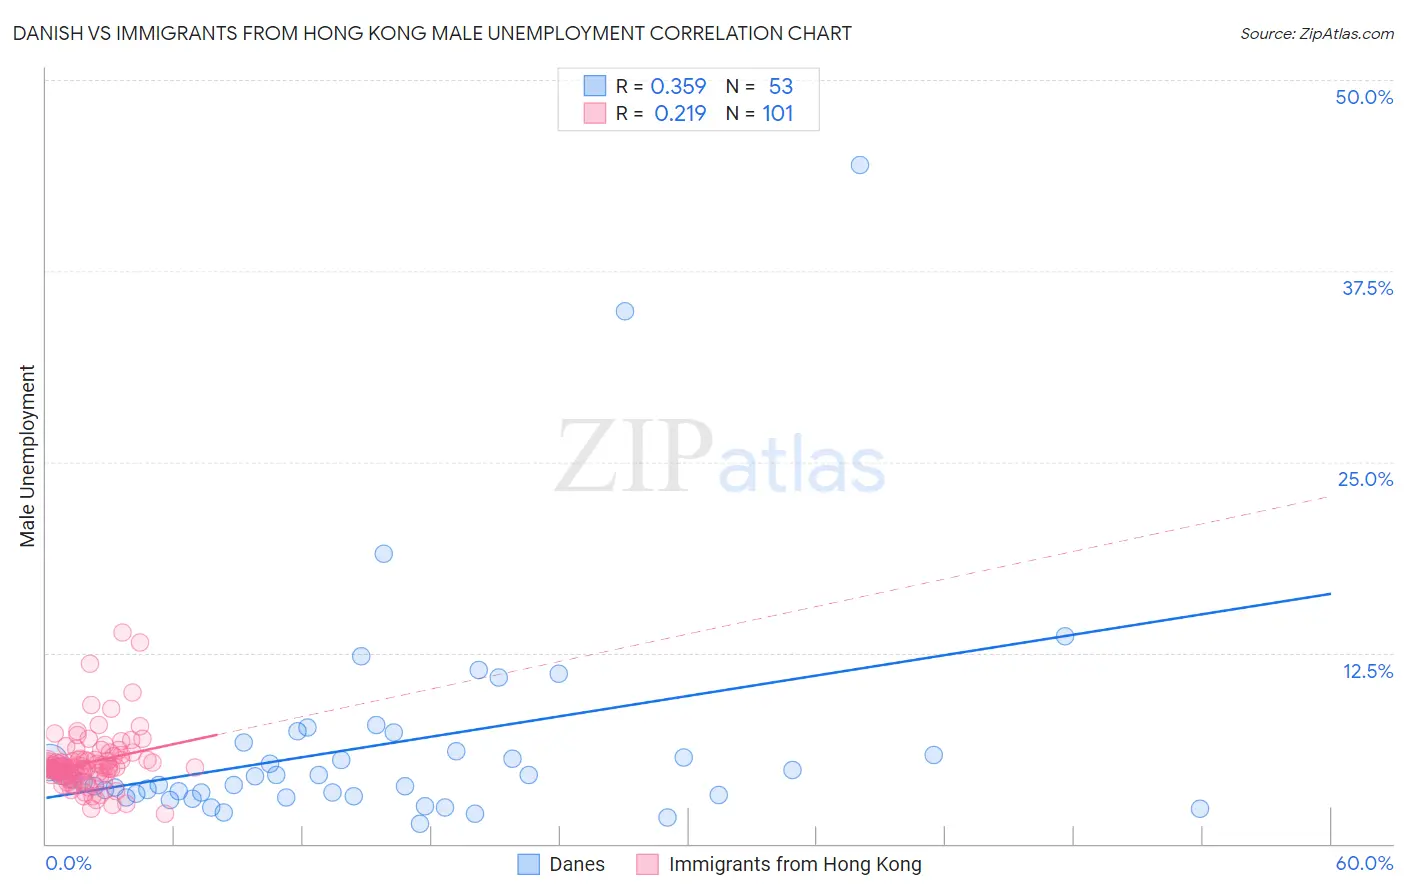
Danish vs Immigrants from Hong Kong Male Unemployment Correlation Chart
The statistical analysis conducted on geographies consisting of 469,242,434 people shows a mild positive correlation between the proportion of Danes and unemployment rate among males in the United States with a correlation coefficient (R) of 0.359 and weighted average of 4.5%. Similarly, the statistical analysis conducted on geographies consisting of 253,631,392 people shows a weak positive correlation between the proportion of Immigrants from Hong Kong and unemployment rate among males in the United States with a correlation coefficient (R) of 0.219 and weighted average of 5.2%, a difference of 16.7%.
Male Unemployment Correlation Summary
| Measurement | Danish | Immigrants from Hong Kong |
| Minimum | 1.3% | 2.0% |
| Maximum | 44.4% | 13.8% |
| Range | 43.1% | 11.8% |
| Mean | 6.5% | 5.3% |
| Median | 4.3% | 5.0% |
| Interquartile 25% (IQ1) | 3.1% | 4.5% |
| Interquartile 75% (IQ3) | 6.3% | 5.5% |
| Interquartile Range (IQR) | 3.2% | 0.99% |
| Standard Deviation (Sample) | 7.5% | 1.9% |
| Standard Deviation (Population) | 7.4% | 1.9% |
Similar Demographics by Male Unemployment
Demographics Similar to Danes by Male Unemployment
In terms of male unemployment, the demographic groups most similar to Danes are Venezuelan (4.5%, a difference of 0.45%), Czech (4.5%, a difference of 0.65%), Luxembourger (4.5%, a difference of 0.91%), Immigrants from Venezuela (4.4%, a difference of 1.0%), and Norwegian (4.4%, a difference of 1.4%).
| Demographics | Rating | Rank | Male Unemployment |
| Immigrants | India | 100.0 /100 | #1 | Exceptional 4.4% |
| Immigrants | Cuba | 100.0 /100 | #2 | Exceptional 4.4% |
| Norwegians | 100.0 /100 | #3 | Exceptional 4.4% |
| Immigrants | Venezuela | 100.0 /100 | #4 | Exceptional 4.4% |
| Danes | 100.0 /100 | #5 | Exceptional 4.5% |
| Venezuelans | 100.0 /100 | #6 | Exceptional 4.5% |
| Czechs | 100.0 /100 | #7 | Exceptional 4.5% |
| Luxembourgers | 100.0 /100 | #8 | Exceptional 4.5% |
| Thais | 100.0 /100 | #9 | Exceptional 4.6% |
| Cubans | 100.0 /100 | #10 | Exceptional 4.6% |
| Swedes | 100.0 /100 | #11 | Exceptional 4.6% |
| Immigrants | Bolivia | 100.0 /100 | #12 | Exceptional 4.7% |
| Bolivians | 100.0 /100 | #13 | Exceptional 4.7% |
| Germans | 100.0 /100 | #14 | Exceptional 4.7% |
| Scandinavians | 100.0 /100 | #15 | Exceptional 4.7% |
Demographics Similar to Immigrants from Hong Kong by Male Unemployment
In terms of male unemployment, the demographic groups most similar to Immigrants from Hong Kong are Immigrants from Egypt (5.2%, a difference of 0.010%), Afghan (5.3%, a difference of 0.24%), South American (5.3%, a difference of 0.32%), Immigrants from China (5.2%, a difference of 0.34%), and Immigrants from Morocco (5.3%, a difference of 0.35%).
| Demographics | Rating | Rank | Male Unemployment |
| Americans | 72.7 /100 | #156 | Good 5.2% |
| Immigrants | Northern Africa | 72.3 /100 | #157 | Good 5.2% |
| Immigrants | Indonesia | 71.5 /100 | #158 | Good 5.2% |
| Indonesians | 71.2 /100 | #159 | Good 5.2% |
| Immigrants | Norway | 71.0 /100 | #160 | Good 5.2% |
| Immigrants | China | 70.6 /100 | #161 | Good 5.2% |
| Immigrants | Egypt | 65.9 /100 | #162 | Good 5.2% |
| Immigrants | Hong Kong | 65.7 /100 | #163 | Good 5.2% |
| Afghans | 62.0 /100 | #164 | Good 5.3% |
| South Americans | 60.6 /100 | #165 | Good 5.3% |
| Immigrants | Morocco | 60.2 /100 | #166 | Good 5.3% |
| Immigrants | Vietnam | 58.1 /100 | #167 | Average 5.3% |
| Immigrants | Ireland | 57.7 /100 | #168 | Average 5.3% |
| Immigrants | Congo | 57.4 /100 | #169 | Average 5.3% |
| Immigrants | Eastern Europe | 54.1 /100 | #170 | Average 5.3% |