Immigrants from Latin America vs Immigrants from Hong Kong Per Capita Income
COMPARE
Immigrants from Latin America
Immigrants from Hong Kong
Per Capita Income
Per Capita Income Comparison
Immigrants from Latin America
Immigrants from Hong Kong
$36,823
PER CAPITA INCOME
0.0/ 100
METRIC RATING
307th/ 347
METRIC RANK
$56,709
PER CAPITA INCOME
100.0/ 100
METRIC RATING
8th/ 347
METRIC RANK
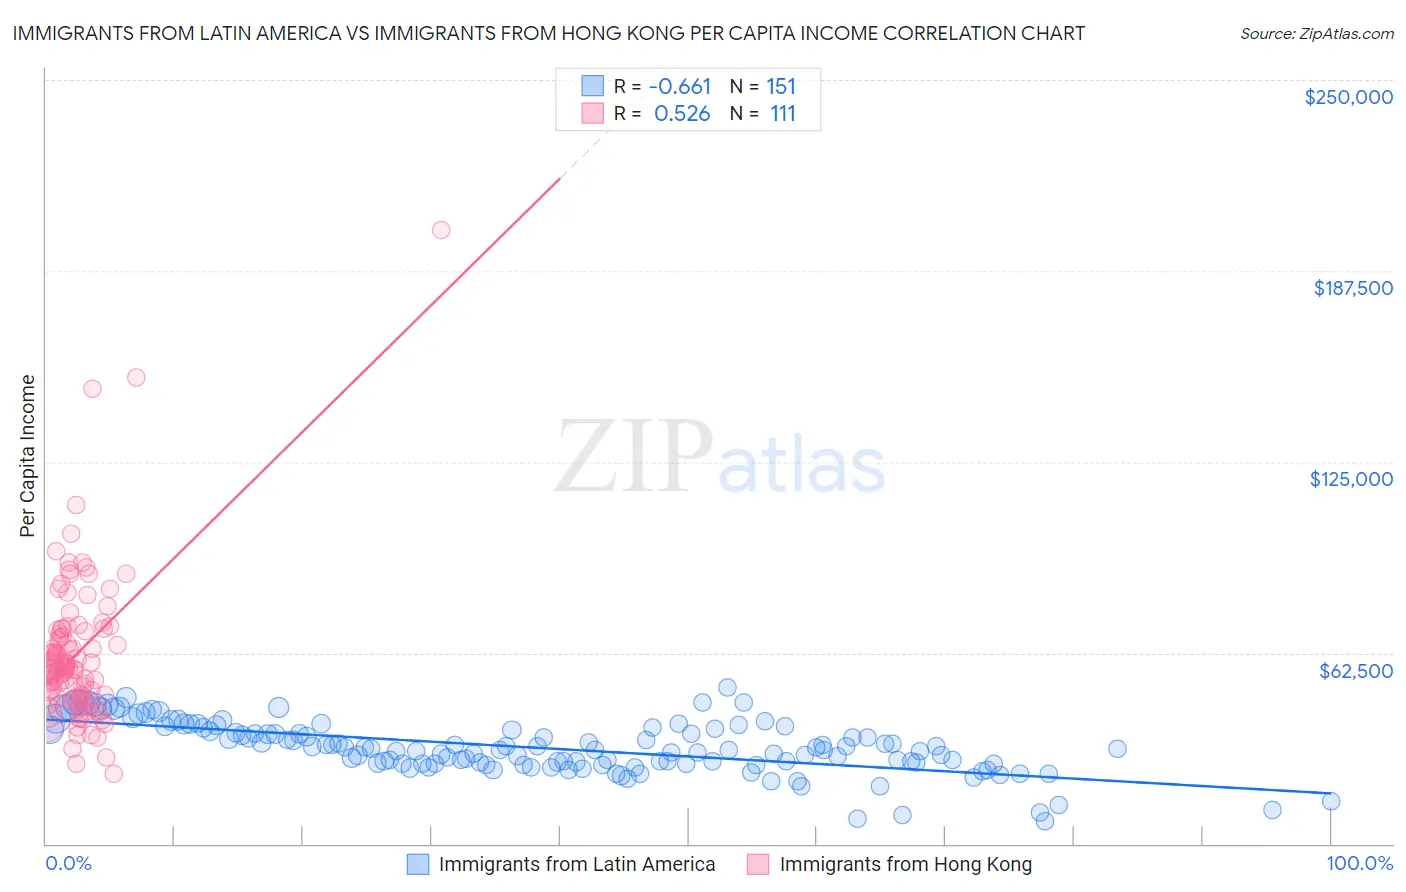
Immigrants from Latin America vs Immigrants from Hong Kong Per Capita Income Correlation Chart
The statistical analysis conducted on geographies consisting of 558,689,902 people shows a significant negative correlation between the proportion of Immigrants from Latin America and per capita income in the United States with a correlation coefficient (R) of -0.661 and weighted average of $36,823. Similarly, the statistical analysis conducted on geographies consisting of 253,979,312 people shows a substantial positive correlation between the proportion of Immigrants from Hong Kong and per capita income in the United States with a correlation coefficient (R) of 0.526 and weighted average of $56,709, a difference of 54.0%.
Per Capita Income Correlation Summary
| Measurement | Immigrants from Latin America | Immigrants from Hong Kong |
| Minimum | $7,365 | $23,001 |
| Maximum | $51,138 | $200,879 |
| Range | $43,773 | $177,878 |
| Mean | $31,346 | $62,312 |
| Median | $30,830 | $57,767 |
| Interquartile 25% (IQ1) | $26,256 | $47,777 |
| Interquartile 75% (IQ3) | $37,351 | $69,849 |
| Interquartile Range (IQR) | $11,095 | $22,072 |
| Standard Deviation (Sample) | $8,475 | $24,374 |
| Standard Deviation (Population) | $8,446 | $24,264 |
Similar Demographics by Per Capita Income
Demographics Similar to Immigrants from Latin America by Per Capita Income
In terms of per capita income, the demographic groups most similar to Immigrants from Latin America are Immigrants from Haiti ($36,849, a difference of 0.070%), Fijian ($36,690, a difference of 0.36%), Immigrants from Honduras ($36,665, a difference of 0.43%), Ute ($36,651, a difference of 0.47%), and Inupiat ($36,999, a difference of 0.48%).
| Demographics | Rating | Rank | Per Capita Income |
| Immigrants | Bahamas | 0.1 /100 | #300 | Tragic $37,193 |
| Ottawa | 0.1 /100 | #301 | Tragic $37,101 |
| Shoshone | 0.1 /100 | #302 | Tragic $37,072 |
| Paiute | 0.1 /100 | #303 | Tragic $37,066 |
| Hondurans | 0.1 /100 | #304 | Tragic $37,031 |
| Inupiat | 0.1 /100 | #305 | Tragic $36,999 |
| Immigrants | Haiti | 0.0 /100 | #306 | Tragic $36,849 |
| Immigrants | Latin America | 0.0 /100 | #307 | Tragic $36,823 |
| Fijians | 0.0 /100 | #308 | Tragic $36,690 |
| Immigrants | Honduras | 0.0 /100 | #309 | Tragic $36,665 |
| Ute | 0.0 /100 | #310 | Tragic $36,651 |
| Chippewa | 0.0 /100 | #311 | Tragic $36,631 |
| Chickasaw | 0.0 /100 | #312 | Tragic $36,475 |
| Bahamians | 0.0 /100 | #313 | Tragic $36,427 |
| Seminole | 0.0 /100 | #314 | Tragic $36,180 |
Demographics Similar to Immigrants from Hong Kong by Per Capita Income
In terms of per capita income, the demographic groups most similar to Immigrants from Hong Kong are Immigrants from Ireland ($56,584, a difference of 0.22%), Immigrants from Israel ($57,384, a difference of 1.2%), Okinawan ($55,817, a difference of 1.6%), Eastern European ($55,780, a difference of 1.7%), and Immigrants from Taiwan ($57,742, a difference of 1.8%).
| Demographics | Rating | Rank | Per Capita Income |
| Filipinos | 100.0 /100 | #1 | Exceptional $59,066 |
| Iranians | 100.0 /100 | #2 | Exceptional $58,786 |
| Immigrants | Singapore | 100.0 /100 | #3 | Exceptional $58,353 |
| Immigrants | Australia | 100.0 /100 | #4 | Exceptional $57,953 |
| Immigrants | Iran | 100.0 /100 | #5 | Exceptional $57,759 |
| Immigrants | Taiwan | 100.0 /100 | #6 | Exceptional $57,742 |
| Immigrants | Israel | 100.0 /100 | #7 | Exceptional $57,384 |
| Immigrants | Hong Kong | 100.0 /100 | #8 | Exceptional $56,709 |
| Immigrants | Ireland | 100.0 /100 | #9 | Exceptional $56,584 |
| Okinawans | 100.0 /100 | #10 | Exceptional $55,817 |
| Eastern Europeans | 100.0 /100 | #11 | Exceptional $55,780 |
| Immigrants | Sweden | 100.0 /100 | #12 | Exceptional $55,582 |
| Immigrants | India | 100.0 /100 | #13 | Exceptional $55,268 |
| Immigrants | Belgium | 100.0 /100 | #14 | Exceptional $55,082 |
| Cypriots | 100.0 /100 | #15 | Exceptional $54,899 |