Serbian vs Chinese Median Household Income
COMPARE
Serbian
Chinese
Median Household Income
Median Household Income Comparison
Serbians
Chinese
$87,572
MEDIAN HOUSEHOLD INCOME
83.0/ 100
METRIC RATING
144th/ 347
METRIC RANK
$98,496
MEDIAN HOUSEHOLD INCOME
100.0/ 100
METRIC RATING
33rd/ 347
METRIC RANK
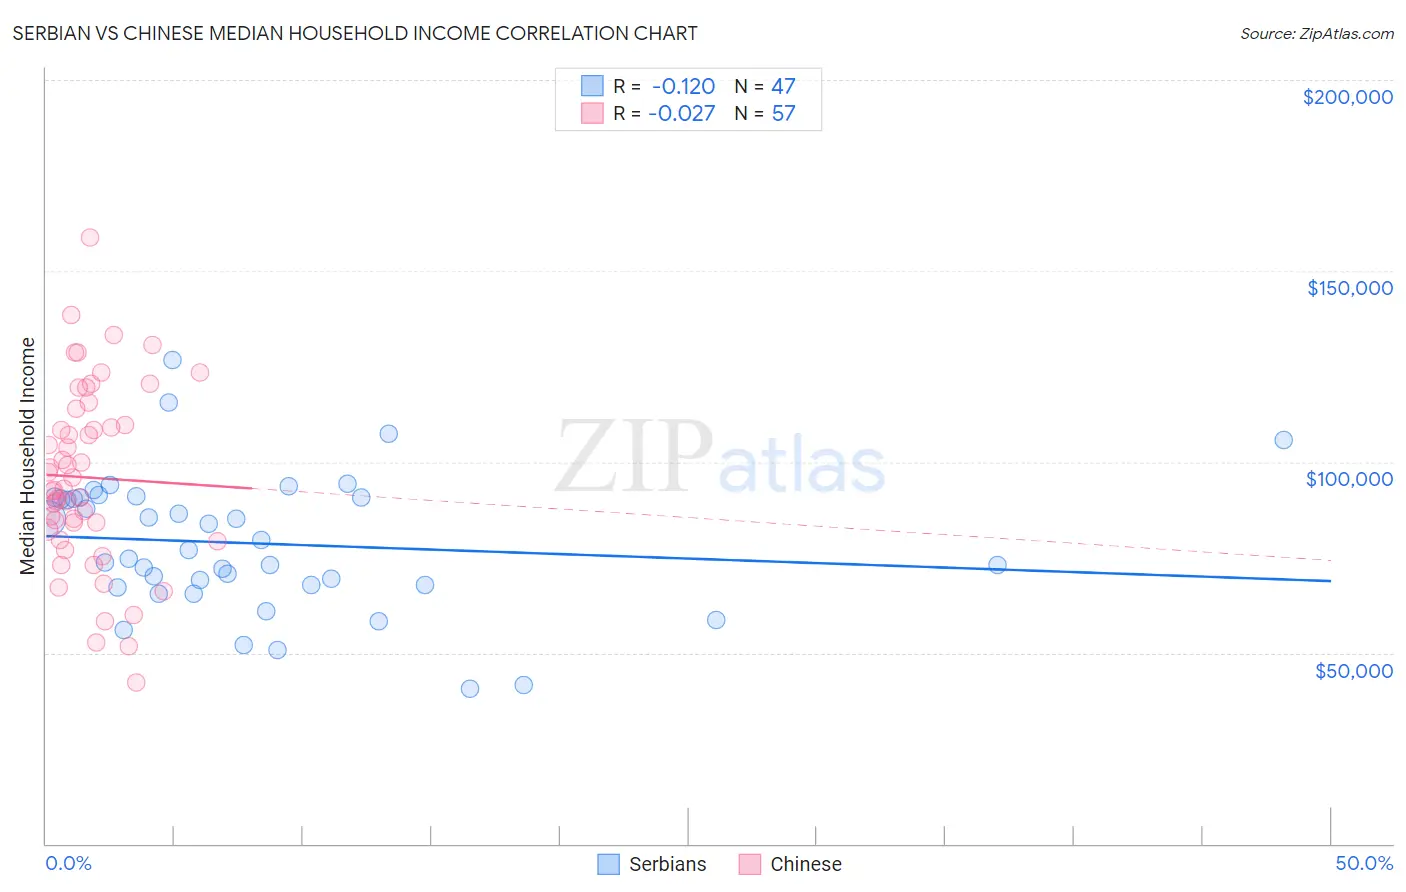
Serbian vs Chinese Median Household Income Correlation Chart
The statistical analysis conducted on geographies consisting of 267,501,646 people shows a poor negative correlation between the proportion of Serbians and median household income in the United States with a correlation coefficient (R) of -0.120 and weighted average of $87,572. Similarly, the statistical analysis conducted on geographies consisting of 64,799,903 people shows no correlation between the proportion of Chinese and median household income in the United States with a correlation coefficient (R) of -0.027 and weighted average of $98,496, a difference of 12.5%.
Median Household Income Correlation Summary
| Measurement | Serbian | Chinese |
| Minimum | $40,500 | $42,222 |
| Maximum | $126,567 | $158,665 |
| Range | $86,067 | $116,443 |
| Mean | $78,611 | $95,906 |
| Median | $76,777 | $92,903 |
| Interquartile 25% (IQ1) | $67,750 | $80,796 |
| Interquartile 75% (IQ3) | $90,729 | $111,792 |
| Interquartile Range (IQR) | $22,979 | $30,996 |
| Standard Deviation (Sample) | $17,894 | $23,711 |
| Standard Deviation (Population) | $17,703 | $23,502 |
Similar Demographics by Median Household Income
Demographics Similar to Serbians by Median Household Income
In terms of median household income, the demographic groups most similar to Serbians are Ugandan ($87,557, a difference of 0.020%), Immigrants from Uganda ($87,553, a difference of 0.020%), Danish ($87,676, a difference of 0.12%), South American Indian ($87,446, a difference of 0.14%), and Canadian ($87,769, a difference of 0.22%).
| Demographics | Rating | Rank | Median Household Income |
| Sierra Leoneans | 89.6 /100 | #137 | Excellent $88,463 |
| Arabs | 89.2 /100 | #138 | Excellent $88,398 |
| Immigrants | Chile | 89.2 /100 | #139 | Excellent $88,388 |
| Lebanese | 87.2 /100 | #140 | Excellent $88,091 |
| Immigrants | Morocco | 86.0 /100 | #141 | Excellent $87,930 |
| Canadians | 84.7 /100 | #142 | Excellent $87,769 |
| Danes | 83.9 /100 | #143 | Excellent $87,676 |
| Serbians | 83.0 /100 | #144 | Excellent $87,572 |
| Ugandans | 82.9 /100 | #145 | Excellent $87,557 |
| Immigrants | Uganda | 82.8 /100 | #146 | Excellent $87,553 |
| South American Indians | 81.8 /100 | #147 | Excellent $87,446 |
| Costa Ricans | 80.0 /100 | #148 | Excellent $87,262 |
| Immigrants | Nepal | 77.7 /100 | #149 | Good $87,046 |
| Basques | 77.2 /100 | #150 | Good $87,001 |
| Hungarians | 76.3 /100 | #151 | Good $86,920 |
Demographics Similar to Chinese by Median Household Income
In terms of median household income, the demographic groups most similar to Chinese are Immigrants from Denmark ($98,510, a difference of 0.010%), Russian ($98,008, a difference of 0.50%), Immigrants from Switzerland ($97,979, a difference of 0.53%), Turkish ($99,389, a difference of 0.91%), and Immigrants from Pakistan ($97,528, a difference of 0.99%).
| Demographics | Rating | Rank | Median Household Income |
| Immigrants | Belgium | 100.0 /100 | #26 | Exceptional $100,306 |
| Bhutanese | 100.0 /100 | #27 | Exceptional $100,151 |
| Immigrants | Sri Lanka | 100.0 /100 | #28 | Exceptional $99,943 |
| Immigrants | Asia | 100.0 /100 | #29 | Exceptional $99,933 |
| Immigrants | Northern Europe | 100.0 /100 | #30 | Exceptional $99,813 |
| Turks | 100.0 /100 | #31 | Exceptional $99,389 |
| Immigrants | Denmark | 100.0 /100 | #32 | Exceptional $98,510 |
| Chinese | 100.0 /100 | #33 | Exceptional $98,496 |
| Russians | 100.0 /100 | #34 | Exceptional $98,008 |
| Immigrants | Switzerland | 100.0 /100 | #35 | Exceptional $97,979 |
| Immigrants | Pakistan | 100.0 /100 | #36 | Exceptional $97,528 |
| Latvians | 100.0 /100 | #37 | Exceptional $97,311 |
| Immigrants | Indonesia | 100.0 /100 | #38 | Exceptional $97,297 |
| Afghans | 100.0 /100 | #39 | Exceptional $97,026 |
| Maltese | 100.0 /100 | #40 | Exceptional $97,015 |