Immigrants from Honduras vs Chinese Median Household Income
COMPARE
Immigrants from Honduras
Chinese
Median Household Income
Median Household Income Comparison
Immigrants from Honduras
Chinese
$71,452
MEDIAN HOUSEHOLD INCOME
0.0/ 100
METRIC RATING
312th/ 347
METRIC RANK
$98,496
MEDIAN HOUSEHOLD INCOME
100.0/ 100
METRIC RATING
33rd/ 347
METRIC RANK
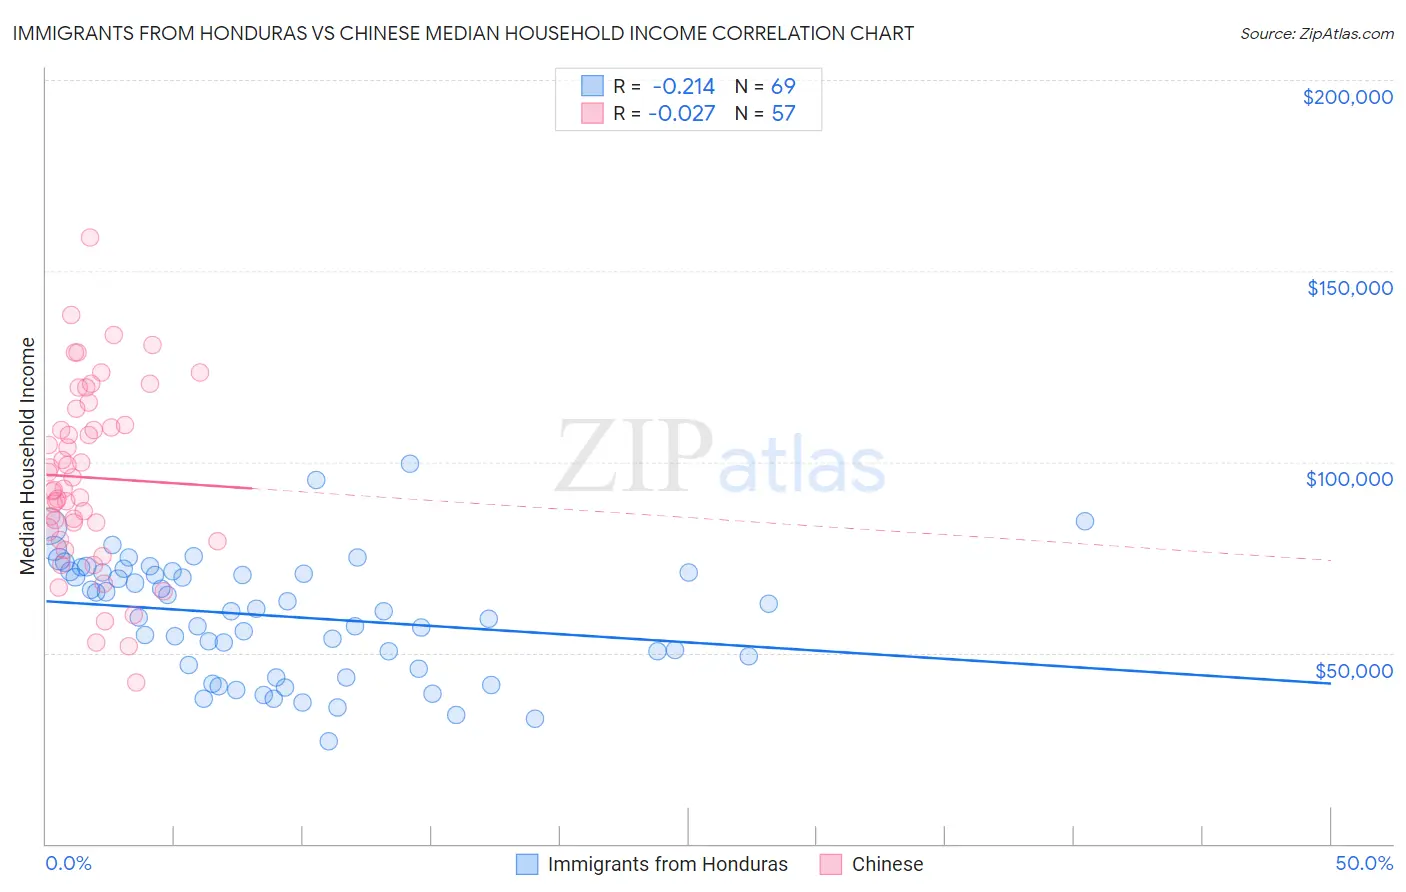
Immigrants from Honduras vs Chinese Median Household Income Correlation Chart
The statistical analysis conducted on geographies consisting of 322,411,098 people shows a weak negative correlation between the proportion of Immigrants from Honduras and median household income in the United States with a correlation coefficient (R) of -0.214 and weighted average of $71,452. Similarly, the statistical analysis conducted on geographies consisting of 64,799,903 people shows no correlation between the proportion of Chinese and median household income in the United States with a correlation coefficient (R) of -0.027 and weighted average of $98,496, a difference of 37.9%.
Median Household Income Correlation Summary
| Measurement | Immigrants from Honduras | Chinese |
| Minimum | $26,822 | $42,222 |
| Maximum | $99,647 | $158,665 |
| Range | $72,825 | $116,443 |
| Mean | $59,604 | $95,906 |
| Median | $60,896 | $92,903 |
| Interquartile 25% (IQ1) | $46,318 | $80,796 |
| Interquartile 75% (IQ3) | $71,168 | $111,792 |
| Interquartile Range (IQR) | $24,849 | $30,996 |
| Standard Deviation (Sample) | $15,574 | $23,711 |
| Standard Deviation (Population) | $15,460 | $23,502 |
Similar Demographics by Median Household Income
Demographics Similar to Immigrants from Honduras by Median Household Income
In terms of median household income, the demographic groups most similar to Immigrants from Honduras are Immigrants from Bahamas ($71,349, a difference of 0.15%), Dominican ($71,302, a difference of 0.21%), Immigrants from Zaire ($71,801, a difference of 0.49%), U.S. Virgin Islander ($71,853, a difference of 0.56%), and Immigrants from Caribbean ($71,860, a difference of 0.57%).
| Demographics | Rating | Rank | Median Household Income |
| Hondurans | 0.0 /100 | #305 | Tragic $72,588 |
| Potawatomi | 0.0 /100 | #306 | Tragic $72,576 |
| Ute | 0.0 /100 | #307 | Tragic $72,402 |
| Yakama | 0.0 /100 | #308 | Tragic $72,225 |
| Immigrants | Caribbean | 0.0 /100 | #309 | Tragic $71,860 |
| U.S. Virgin Islanders | 0.0 /100 | #310 | Tragic $71,853 |
| Immigrants | Zaire | 0.0 /100 | #311 | Tragic $71,801 |
| Immigrants | Honduras | 0.0 /100 | #312 | Tragic $71,452 |
| Immigrants | Bahamas | 0.0 /100 | #313 | Tragic $71,349 |
| Dominicans | 0.0 /100 | #314 | Tragic $71,302 |
| Ottawa | 0.0 /100 | #315 | Tragic $70,984 |
| Apache | 0.0 /100 | #316 | Tragic $70,927 |
| Cajuns | 0.0 /100 | #317 | Tragic $70,605 |
| Chippewa | 0.0 /100 | #318 | Tragic $70,539 |
| Immigrants | Dominican Republic | 0.0 /100 | #319 | Tragic $70,208 |
Demographics Similar to Chinese by Median Household Income
In terms of median household income, the demographic groups most similar to Chinese are Immigrants from Denmark ($98,510, a difference of 0.010%), Russian ($98,008, a difference of 0.50%), Immigrants from Switzerland ($97,979, a difference of 0.53%), Turkish ($99,389, a difference of 0.91%), and Immigrants from Pakistan ($97,528, a difference of 0.99%).
| Demographics | Rating | Rank | Median Household Income |
| Immigrants | Belgium | 100.0 /100 | #26 | Exceptional $100,306 |
| Bhutanese | 100.0 /100 | #27 | Exceptional $100,151 |
| Immigrants | Sri Lanka | 100.0 /100 | #28 | Exceptional $99,943 |
| Immigrants | Asia | 100.0 /100 | #29 | Exceptional $99,933 |
| Immigrants | Northern Europe | 100.0 /100 | #30 | Exceptional $99,813 |
| Turks | 100.0 /100 | #31 | Exceptional $99,389 |
| Immigrants | Denmark | 100.0 /100 | #32 | Exceptional $98,510 |
| Chinese | 100.0 /100 | #33 | Exceptional $98,496 |
| Russians | 100.0 /100 | #34 | Exceptional $98,008 |
| Immigrants | Switzerland | 100.0 /100 | #35 | Exceptional $97,979 |
| Immigrants | Pakistan | 100.0 /100 | #36 | Exceptional $97,528 |
| Latvians | 100.0 /100 | #37 | Exceptional $97,311 |
| Immigrants | Indonesia | 100.0 /100 | #38 | Exceptional $97,297 |
| Afghans | 100.0 /100 | #39 | Exceptional $97,026 |
| Maltese | 100.0 /100 | #40 | Exceptional $97,015 |