Immigrants from El Salvador vs Chinese Median Household Income
COMPARE
Immigrants from El Salvador
Chinese
Median Household Income
Median Household Income Comparison
Immigrants from El Salvador
Chinese
$81,213
MEDIAN HOUSEHOLD INCOME
7.6/ 100
METRIC RATING
223rd/ 347
METRIC RANK
$98,496
MEDIAN HOUSEHOLD INCOME
100.0/ 100
METRIC RATING
33rd/ 347
METRIC RANK
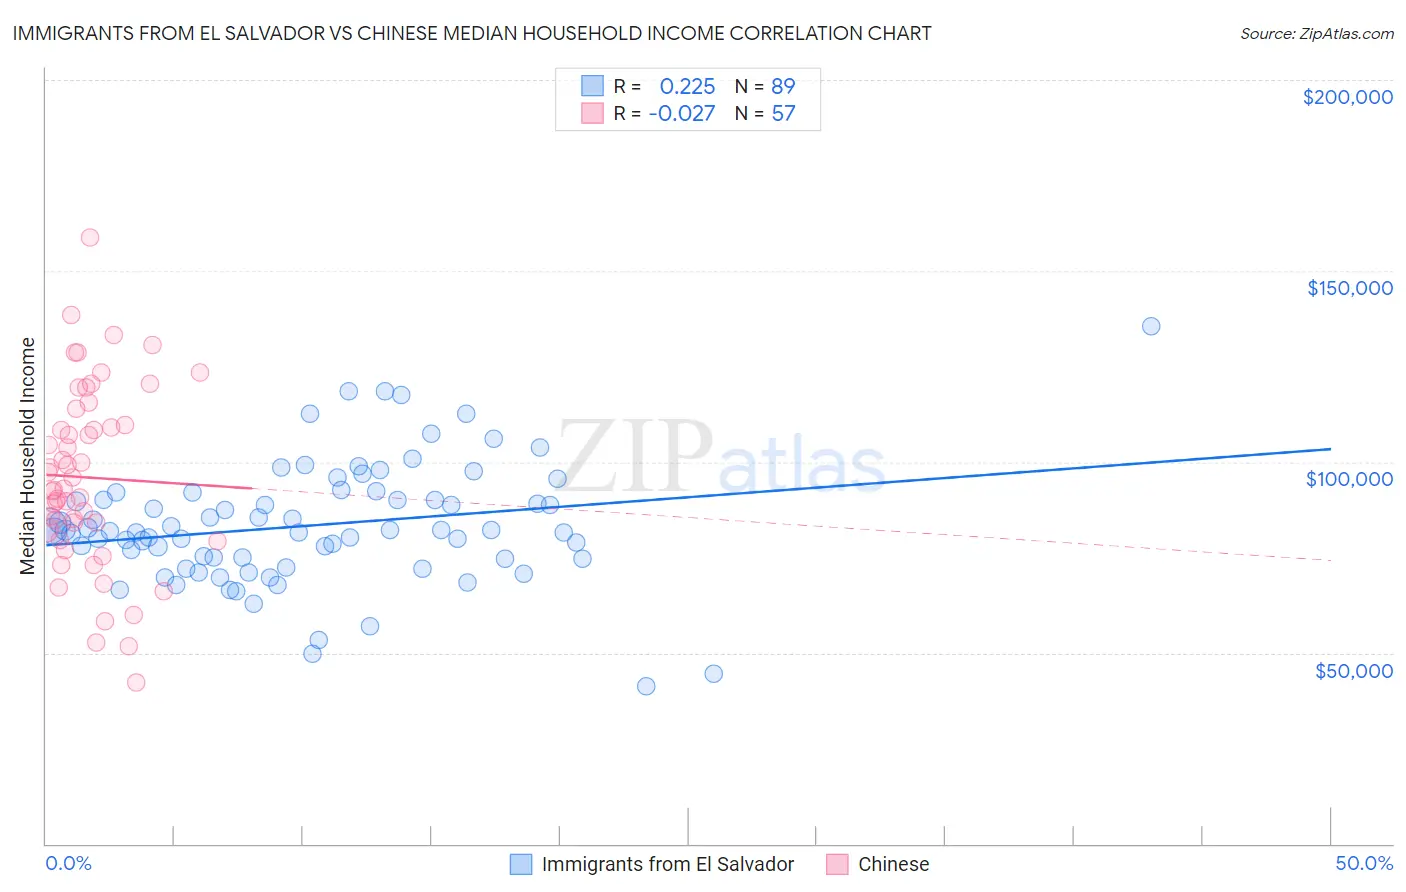
Immigrants from El Salvador vs Chinese Median Household Income Correlation Chart
The statistical analysis conducted on geographies consisting of 357,662,505 people shows a weak positive correlation between the proportion of Immigrants from El Salvador and median household income in the United States with a correlation coefficient (R) of 0.225 and weighted average of $81,213. Similarly, the statistical analysis conducted on geographies consisting of 64,799,903 people shows no correlation between the proportion of Chinese and median household income in the United States with a correlation coefficient (R) of -0.027 and weighted average of $98,496, a difference of 21.3%.
Median Household Income Correlation Summary
| Measurement | Immigrants from El Salvador | Chinese |
| Minimum | $41,123 | $42,222 |
| Maximum | $135,638 | $158,665 |
| Range | $94,515 | $116,443 |
| Mean | $83,315 | $95,906 |
| Median | $81,957 | $92,903 |
| Interquartile 25% (IQ1) | $74,629 | $80,796 |
| Interquartile 75% (IQ3) | $91,081 | $111,792 |
| Interquartile Range (IQR) | $16,452 | $30,996 |
| Standard Deviation (Sample) | $15,893 | $23,711 |
| Standard Deviation (Population) | $15,803 | $23,502 |
Similar Demographics by Median Household Income
Demographics Similar to Immigrants from El Salvador by Median Household Income
In terms of median household income, the demographic groups most similar to Immigrants from El Salvador are Immigrants from Nigeria ($81,236, a difference of 0.030%), Malaysian ($81,064, a difference of 0.18%), Scotch-Irish ($80,972, a difference of 0.30%), Immigrants from Ghana ($81,489, a difference of 0.34%), and Immigrants from Venezuela ($81,506, a difference of 0.36%).
| Demographics | Rating | Rank | Median Household Income |
| Yugoslavians | 13.3 /100 | #216 | Poor $82,186 |
| Ecuadorians | 12.5 /100 | #217 | Poor $82,070 |
| Whites/Caucasians | 12.2 /100 | #218 | Poor $82,029 |
| Nigerians | 10.3 /100 | #219 | Poor $81,725 |
| Immigrants | Venezuela | 9.0 /100 | #220 | Tragic $81,506 |
| Immigrants | Ghana | 9.0 /100 | #221 | Tragic $81,489 |
| Immigrants | Nigeria | 7.7 /100 | #222 | Tragic $81,236 |
| Immigrants | El Salvador | 7.6 /100 | #223 | Tragic $81,213 |
| Malaysians | 7.0 /100 | #224 | Tragic $81,064 |
| Scotch-Irish | 6.6 /100 | #225 | Tragic $80,972 |
| Immigrants | Panama | 6.2 /100 | #226 | Tragic $80,873 |
| Guyanese | 5.7 /100 | #227 | Tragic $80,734 |
| Immigrants | Bangladesh | 5.7 /100 | #228 | Tragic $80,722 |
| Delaware | 5.0 /100 | #229 | Tragic $80,527 |
| Bermudans | 4.7 /100 | #230 | Tragic $80,406 |
Demographics Similar to Chinese by Median Household Income
In terms of median household income, the demographic groups most similar to Chinese are Immigrants from Denmark ($98,510, a difference of 0.010%), Russian ($98,008, a difference of 0.50%), Immigrants from Switzerland ($97,979, a difference of 0.53%), Turkish ($99,389, a difference of 0.91%), and Immigrants from Pakistan ($97,528, a difference of 0.99%).
| Demographics | Rating | Rank | Median Household Income |
| Immigrants | Belgium | 100.0 /100 | #26 | Exceptional $100,306 |
| Bhutanese | 100.0 /100 | #27 | Exceptional $100,151 |
| Immigrants | Sri Lanka | 100.0 /100 | #28 | Exceptional $99,943 |
| Immigrants | Asia | 100.0 /100 | #29 | Exceptional $99,933 |
| Immigrants | Northern Europe | 100.0 /100 | #30 | Exceptional $99,813 |
| Turks | 100.0 /100 | #31 | Exceptional $99,389 |
| Immigrants | Denmark | 100.0 /100 | #32 | Exceptional $98,510 |
| Chinese | 100.0 /100 | #33 | Exceptional $98,496 |
| Russians | 100.0 /100 | #34 | Exceptional $98,008 |
| Immigrants | Switzerland | 100.0 /100 | #35 | Exceptional $97,979 |
| Immigrants | Pakistan | 100.0 /100 | #36 | Exceptional $97,528 |
| Latvians | 100.0 /100 | #37 | Exceptional $97,311 |
| Immigrants | Indonesia | 100.0 /100 | #38 | Exceptional $97,297 |
| Afghans | 100.0 /100 | #39 | Exceptional $97,026 |
| Maltese | 100.0 /100 | #40 | Exceptional $97,015 |