Cuban vs Immigrants from Venezuela In Labor Force | Age 20-24
COMPARE
Cuban
Immigrants from Venezuela
In Labor Force | Age 20-24
In Labor Force | Age 20-24 Comparison
Cubans
Immigrants from Venezuela
72.5%
IN LABOR FORCE | AGE 20-24
0.0/ 100
METRIC RATING
301st/ 347
METRIC RANK
73.2%
IN LABOR FORCE | AGE 20-24
0.1/ 100
METRIC RATING
281st/ 347
METRIC RANK
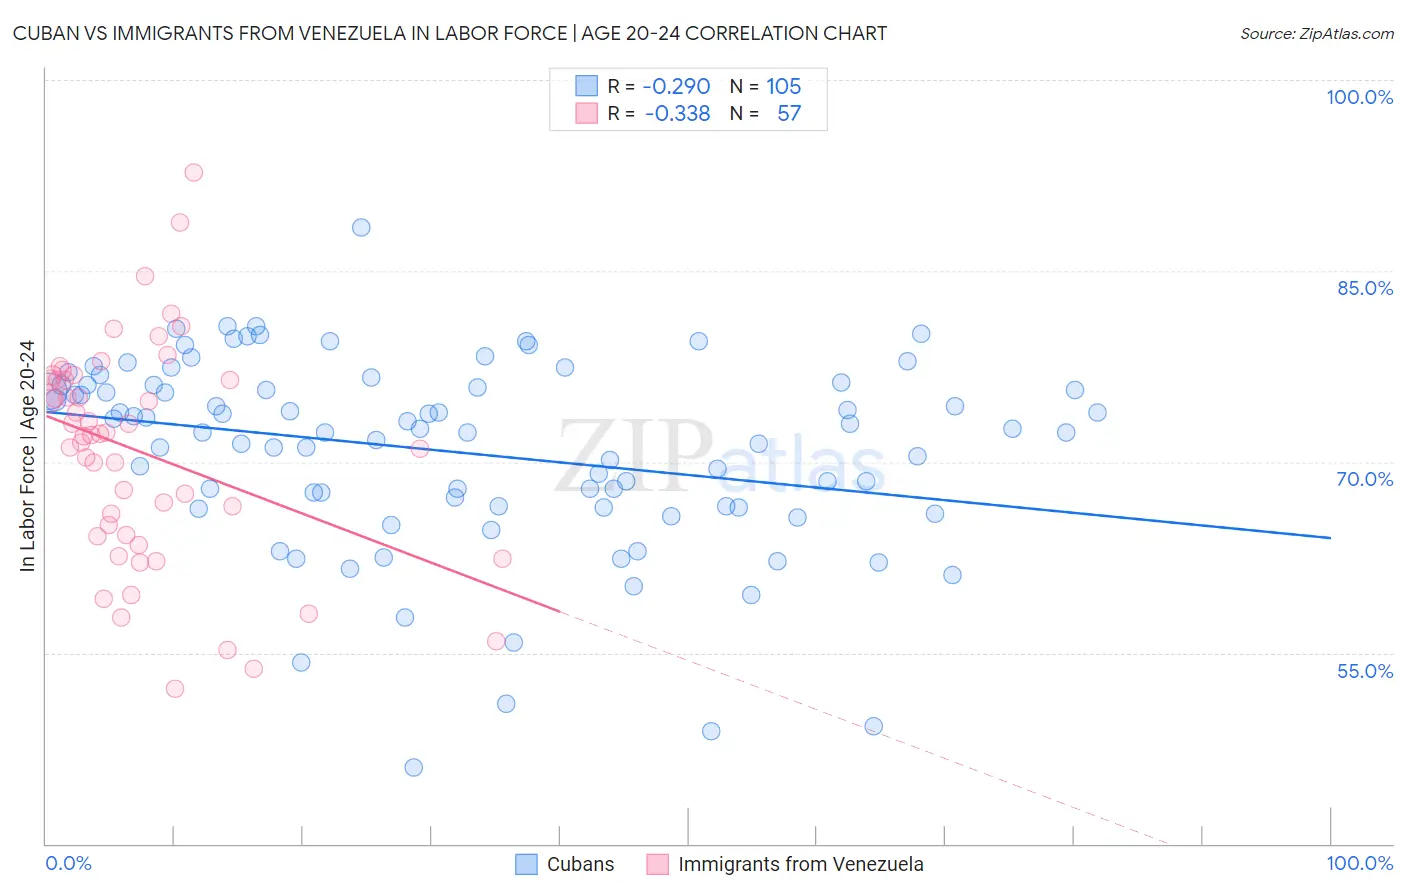
Cuban vs Immigrants from Venezuela In Labor Force | Age 20-24 Correlation Chart
The statistical analysis conducted on geographies consisting of 449,113,848 people shows a weak negative correlation between the proportion of Cubans and labor force participation rate among population between the ages 20 and 24 in the United States with a correlation coefficient (R) of -0.290 and weighted average of 72.5%. Similarly, the statistical analysis conducted on geographies consisting of 287,836,016 people shows a mild negative correlation between the proportion of Immigrants from Venezuela and labor force participation rate among population between the ages 20 and 24 in the United States with a correlation coefficient (R) of -0.338 and weighted average of 73.2%, a difference of 1.0%.
In Labor Force | Age 20-24 Correlation Summary
| Measurement | Cuban | Immigrants from Venezuela |
| Minimum | 46.0% | 52.2% |
| Maximum | 88.4% | 92.7% |
| Range | 42.4% | 40.5% |
| Mean | 70.8% | 70.7% |
| Median | 72.4% | 72.1% |
| Interquartile 25% (IQ1) | 66.4% | 64.2% |
| Interquartile 75% (IQ3) | 76.0% | 76.5% |
| Interquartile Range (IQR) | 9.6% | 12.2% |
| Standard Deviation (Sample) | 7.6% | 8.6% |
| Standard Deviation (Population) | 7.6% | 8.5% |
Demographics Similar to Cubans and Immigrants from Venezuela by In Labor Force | Age 20-24
In terms of in labor force | age 20-24, the demographic groups most similar to Cubans are Armenian (72.5%, a difference of 0.070%), Iranian (72.6%, a difference of 0.090%), Israeli (72.6%, a difference of 0.14%), Central American Indian (72.7%, a difference of 0.26%), and Jamaican (72.7%, a difference of 0.31%). Similarly, the demographic groups most similar to Immigrants from Venezuela are Immigrants from Spain (73.2%, a difference of 0.010%), Immigrants from Bahamas (73.2%, a difference of 0.010%), Kiowa (73.2%, a difference of 0.040%), Nicaraguan (73.2%, a difference of 0.090%), and Immigrants from Lebanon (73.1%, a difference of 0.13%).
| Demographics | Rating | Rank | In Labor Force | Age 20-24 |
| Immigrants | Venezuela | 0.1 /100 | #281 | Tragic 73.2% |
| Immigrants | Spain | 0.1 /100 | #282 | Tragic 73.2% |
| Immigrants | Bahamas | 0.1 /100 | #283 | Tragic 73.2% |
| Kiowa | 0.1 /100 | #284 | Tragic 73.2% |
| Nicaraguans | 0.1 /100 | #285 | Tragic 73.2% |
| Immigrants | Lebanon | 0.1 /100 | #286 | Tragic 73.1% |
| Immigrants | Korea | 0.1 /100 | #287 | Tragic 73.1% |
| Argentineans | 0.1 /100 | #288 | Tragic 73.1% |
| U.S. Virgin Islanders | 0.1 /100 | #289 | Tragic 73.0% |
| Immigrants | Belarus | 0.1 /100 | #290 | Tragic 73.0% |
| Immigrants | Nicaragua | 0.0 /100 | #291 | Tragic 72.9% |
| Pueblo | 0.0 /100 | #292 | Tragic 72.9% |
| Immigrants | Belize | 0.0 /100 | #293 | Tragic 72.8% |
| Immigrants | Argentina | 0.0 /100 | #294 | Tragic 72.8% |
| Okinawans | 0.0 /100 | #295 | Tragic 72.7% |
| Jamaicans | 0.0 /100 | #296 | Tragic 72.7% |
| Central American Indians | 0.0 /100 | #297 | Tragic 72.7% |
| Israelis | 0.0 /100 | #298 | Tragic 72.6% |
| Iranians | 0.0 /100 | #299 | Tragic 72.6% |
| Armenians | 0.0 /100 | #300 | Tragic 72.5% |
| Cubans | 0.0 /100 | #301 | Tragic 72.5% |