Kiowa vs Immigrants from Venezuela Median Family Income
COMPARE
Kiowa
Immigrants from Venezuela
Median Family Income
Median Family Income Comparison
Kiowa
Immigrants from Venezuela
$80,885
MEDIAN FAMILY INCOME
0.0/ 100
METRIC RATING
333rd/ 347
METRIC RANK
$94,904
MEDIAN FAMILY INCOME
1.9/ 100
METRIC RATING
232nd/ 347
METRIC RANK
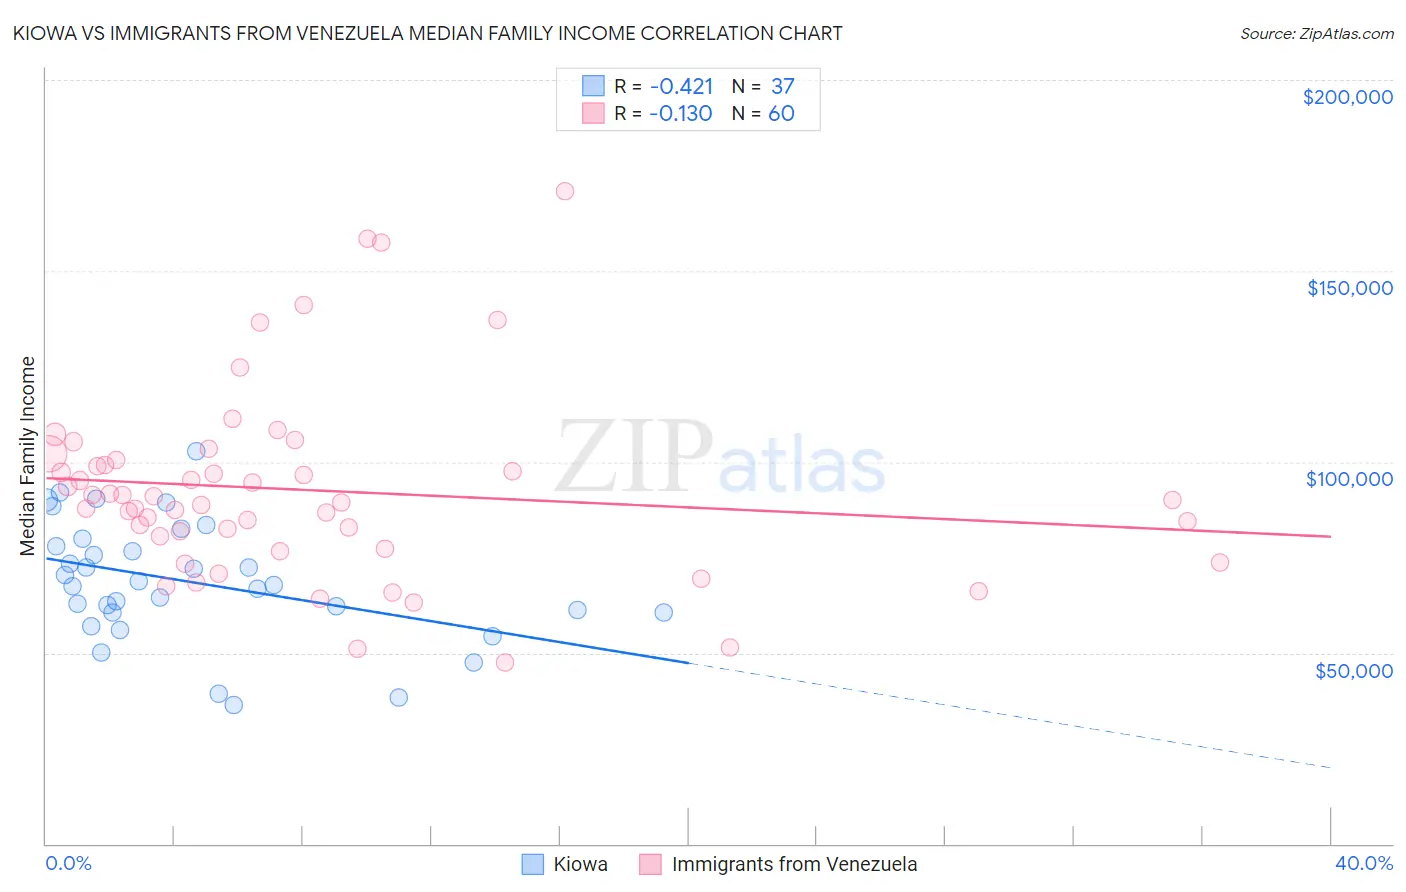
Kiowa vs Immigrants from Venezuela Median Family Income Correlation Chart
The statistical analysis conducted on geographies consisting of 56,095,481 people shows a moderate negative correlation between the proportion of Kiowa and median family income in the United States with a correlation coefficient (R) of -0.421 and weighted average of $80,885. Similarly, the statistical analysis conducted on geographies consisting of 287,745,921 people shows a poor negative correlation between the proportion of Immigrants from Venezuela and median family income in the United States with a correlation coefficient (R) of -0.130 and weighted average of $94,904, a difference of 17.3%.
Median Family Income Correlation Summary
| Measurement | Kiowa | Immigrants from Venezuela |
| Minimum | $36,250 | $47,465 |
| Maximum | $102,708 | $170,845 |
| Range | $66,458 | $123,380 |
| Mean | $68,555 | $92,607 |
| Median | $67,750 | $89,644 |
| Interquartile 25% (IQ1) | $60,573 | $78,947 |
| Interquartile 75% (IQ3) | $79,021 | $99,865 |
| Interquartile Range (IQR) | $18,448 | $20,918 |
| Standard Deviation (Sample) | $15,572 | $24,843 |
| Standard Deviation (Population) | $15,360 | $24,635 |
Similar Demographics by Median Family Income
Demographics Similar to Kiowa by Median Family Income
In terms of median family income, the demographic groups most similar to Kiowa are Native/Alaskan ($80,908, a difference of 0.030%), Immigrants from Dominican Republic ($81,233, a difference of 0.43%), Cheyenne ($81,385, a difference of 0.62%), Dutch West Indian ($81,852, a difference of 1.2%), and Black/African American ($81,912, a difference of 1.3%).
| Demographics | Rating | Rank | Median Family Income |
| Immigrants | Congo | 0.0 /100 | #326 | Tragic $82,216 |
| Arapaho | 0.0 /100 | #327 | Tragic $82,064 |
| Blacks/African Americans | 0.0 /100 | #328 | Tragic $81,912 |
| Dutch West Indians | 0.0 /100 | #329 | Tragic $81,852 |
| Cheyenne | 0.0 /100 | #330 | Tragic $81,385 |
| Immigrants | Dominican Republic | 0.0 /100 | #331 | Tragic $81,233 |
| Natives/Alaskans | 0.0 /100 | #332 | Tragic $80,908 |
| Kiowa | 0.0 /100 | #333 | Tragic $80,885 |
| Menominee | 0.0 /100 | #334 | Tragic $79,563 |
| Yup'ik | 0.0 /100 | #335 | Tragic $79,290 |
| Immigrants | Cuba | 0.0 /100 | #336 | Tragic $78,249 |
| Yuman | 0.0 /100 | #337 | Tragic $78,055 |
| Immigrants | Yemen | 0.0 /100 | #338 | Tragic $77,457 |
| Pima | 0.0 /100 | #339 | Tragic $77,431 |
| Hopi | 0.0 /100 | #340 | Tragic $77,188 |
Demographics Similar to Immigrants from Venezuela by Median Family Income
In terms of median family income, the demographic groups most similar to Immigrants from Venezuela are Ecuadorian ($95,114, a difference of 0.22%), Immigrants from Bangladesh ($94,665, a difference of 0.25%), Immigrants from Western Africa ($94,638, a difference of 0.28%), Malaysian ($95,230, a difference of 0.34%), and Marshallese ($95,293, a difference of 0.41%).
| Demographics | Rating | Rank | Median Family Income |
| Vietnamese | 3.4 /100 | #225 | Tragic $96,123 |
| Immigrants | Panama | 2.7 /100 | #226 | Tragic $95,647 |
| Alaska Natives | 2.6 /100 | #227 | Tragic $95,573 |
| Immigrants | Azores | 2.4 /100 | #228 | Tragic $95,402 |
| Marshallese | 2.2 /100 | #229 | Tragic $95,293 |
| Malaysians | 2.2 /100 | #230 | Tragic $95,230 |
| Ecuadorians | 2.1 /100 | #231 | Tragic $95,114 |
| Immigrants | Venezuela | 1.9 /100 | #232 | Tragic $94,904 |
| Immigrants | Bangladesh | 1.6 /100 | #233 | Tragic $94,665 |
| Immigrants | Western Africa | 1.6 /100 | #234 | Tragic $94,638 |
| Immigrants | Burma/Myanmar | 1.5 /100 | #235 | Tragic $94,472 |
| Trinidadians and Tobagonians | 1.5 /100 | #236 | Tragic $94,466 |
| Alaskan Athabascans | 1.5 /100 | #237 | Tragic $94,429 |
| Nepalese | 1.3 /100 | #238 | Tragic $94,153 |
| Salvadorans | 1.2 /100 | #239 | Tragic $94,109 |