Cuban vs Immigrants from Taiwan Bachelor's Degree
COMPARE
Cuban
Immigrants from Taiwan
Bachelor's Degree
Bachelor's Degree Comparison
Cubans
Immigrants from Taiwan
32.5%
BACHELOR'S DEGREE
0.3/ 100
METRIC RATING
267th/ 347
METRIC RANK
51.2%
BACHELOR'S DEGREE
100.0/ 100
METRIC RATING
4th/ 347
METRIC RANK
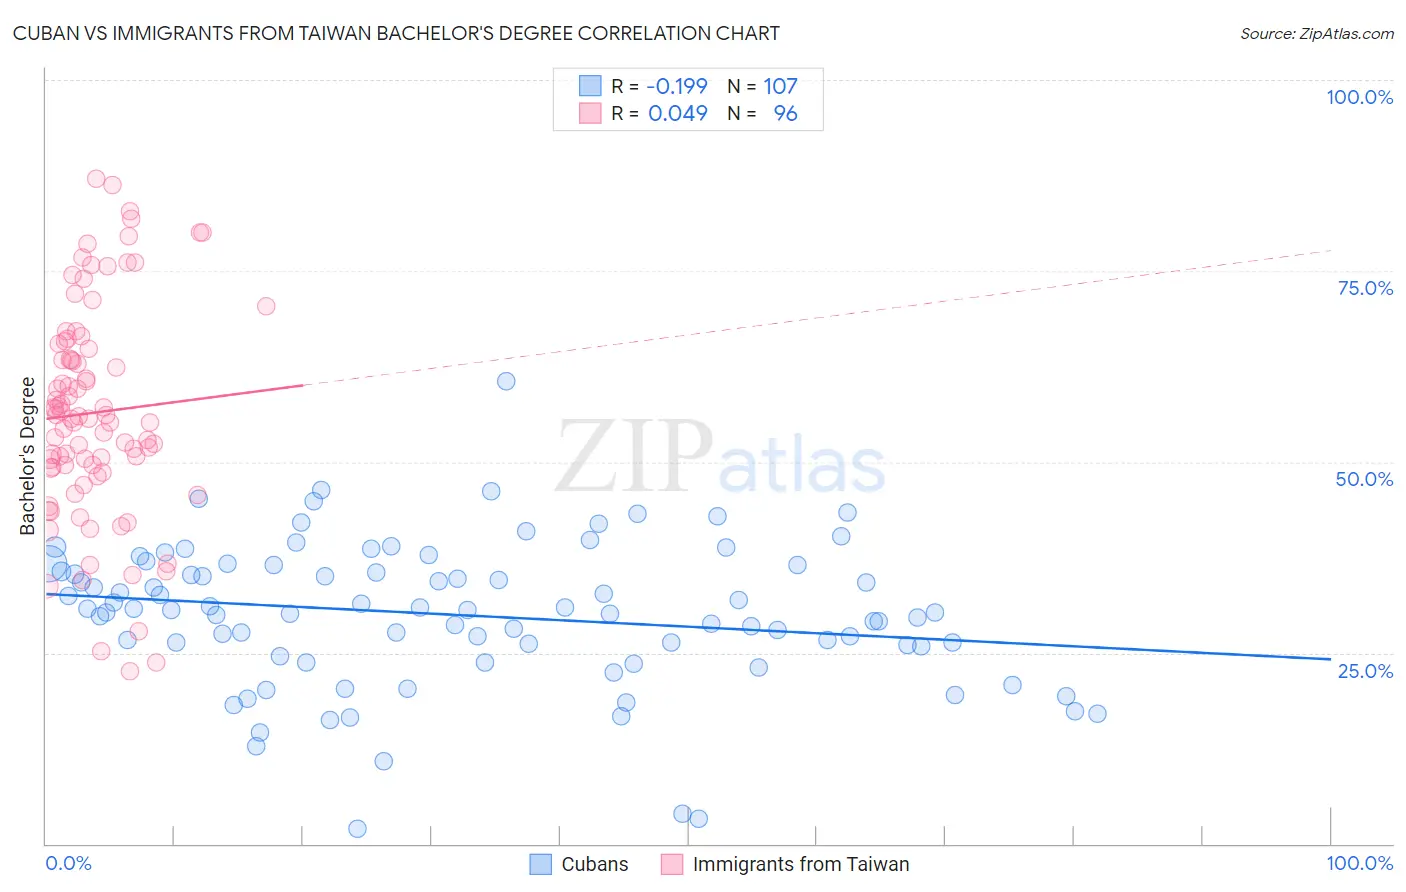
Cuban vs Immigrants from Taiwan Bachelor's Degree Correlation Chart
The statistical analysis conducted on geographies consisting of 449,220,145 people shows a poor negative correlation between the proportion of Cubans and percentage of population with at least bachelor's degree education in the United States with a correlation coefficient (R) of -0.199 and weighted average of 32.5%. Similarly, the statistical analysis conducted on geographies consisting of 298,272,482 people shows no correlation between the proportion of Immigrants from Taiwan and percentage of population with at least bachelor's degree education in the United States with a correlation coefficient (R) of 0.049 and weighted average of 51.2%, a difference of 57.6%.
Bachelor's Degree Correlation Summary
| Measurement | Cuban | Immigrants from Taiwan |
| Minimum | 2.0% | 22.6% |
| Maximum | 60.5% | 87.1% |
| Range | 58.5% | 64.5% |
| Mean | 30.0% | 56.5% |
| Median | 30.6% | 55.9% |
| Interquartile 25% (IQ1) | 25.9% | 49.3% |
| Interquartile 75% (IQ3) | 36.5% | 65.1% |
| Interquartile Range (IQR) | 10.6% | 15.9% |
| Standard Deviation (Sample) | 9.5% | 14.1% |
| Standard Deviation (Population) | 9.5% | 14.0% |
Similar Demographics by Bachelor's Degree
Demographics Similar to Cubans by Bachelor's Degree
In terms of bachelor's degree, the demographic groups most similar to Cubans are Immigrants from Dominica (32.5%, a difference of 0.12%), Bahamian (32.5%, a difference of 0.15%), Central American Indian (32.5%, a difference of 0.18%), Immigrants from Portugal (32.2%, a difference of 0.76%), and Belizean (32.8%, a difference of 0.96%).
| Demographics | Rating | Rank | Bachelor's Degree |
| Malaysians | 0.5 /100 | #260 | Tragic 32.9% |
| Africans | 0.5 /100 | #261 | Tragic 32.9% |
| Immigrants | Jamaica | 0.5 /100 | #262 | Tragic 32.9% |
| Belizeans | 0.4 /100 | #263 | Tragic 32.8% |
| Central American Indians | 0.3 /100 | #264 | Tragic 32.5% |
| Bahamians | 0.3 /100 | #265 | Tragic 32.5% |
| Immigrants | Dominica | 0.3 /100 | #266 | Tragic 32.5% |
| Cubans | 0.3 /100 | #267 | Tragic 32.5% |
| Immigrants | Portugal | 0.2 /100 | #268 | Tragic 32.2% |
| Immigrants | Belize | 0.2 /100 | #269 | Tragic 32.1% |
| Immigrants | Nicaragua | 0.2 /100 | #270 | Tragic 31.9% |
| Central Americans | 0.2 /100 | #271 | Tragic 31.9% |
| Comanche | 0.2 /100 | #272 | Tragic 31.9% |
| Americans | 0.2 /100 | #273 | Tragic 31.9% |
| Potawatomi | 0.2 /100 | #274 | Tragic 31.9% |
Demographics Similar to Immigrants from Taiwan by Bachelor's Degree
In terms of bachelor's degree, the demographic groups most similar to Immigrants from Taiwan are Immigrants from India (51.3%, a difference of 0.21%), Iranian (51.0%, a difference of 0.42%), Okinawan (50.5%, a difference of 1.3%), Immigrants from Singapore (51.9%, a difference of 1.4%), and Immigrants from Iran (50.3%, a difference of 1.7%).
| Demographics | Rating | Rank | Bachelor's Degree |
| Filipinos | 100.0 /100 | #1 | Exceptional 52.7% |
| Immigrants | Singapore | 100.0 /100 | #2 | Exceptional 51.9% |
| Immigrants | India | 100.0 /100 | #3 | Exceptional 51.3% |
| Immigrants | Taiwan | 100.0 /100 | #4 | Exceptional 51.2% |
| Iranians | 100.0 /100 | #5 | Exceptional 51.0% |
| Okinawans | 100.0 /100 | #6 | Exceptional 50.5% |
| Immigrants | Iran | 100.0 /100 | #7 | Exceptional 50.3% |
| Thais | 100.0 /100 | #8 | Exceptional 50.1% |
| Immigrants | Israel | 100.0 /100 | #9 | Exceptional 50.0% |
| Cypriots | 100.0 /100 | #10 | Exceptional 49.0% |
| Immigrants | Australia | 100.0 /100 | #11 | Exceptional 48.5% |
| Immigrants | China | 100.0 /100 | #12 | Exceptional 48.4% |
| Immigrants | South Central Asia | 100.0 /100 | #13 | Exceptional 48.3% |
| Immigrants | Hong Kong | 100.0 /100 | #14 | Exceptional 48.2% |
| Immigrants | Eastern Asia | 100.0 /100 | #15 | Exceptional 48.1% |