Indonesian vs Immigrants from Taiwan Median Family Income
COMPARE
Indonesian
Immigrants from Taiwan
Median Family Income
Median Family Income Comparison
Indonesians
Immigrants from Taiwan
$88,301
MEDIAN FAMILY INCOME
0.1/ 100
METRIC RATING
284th/ 347
METRIC RANK
$136,949
MEDIAN FAMILY INCOME
100.0/ 100
METRIC RATING
2nd/ 347
METRIC RANK
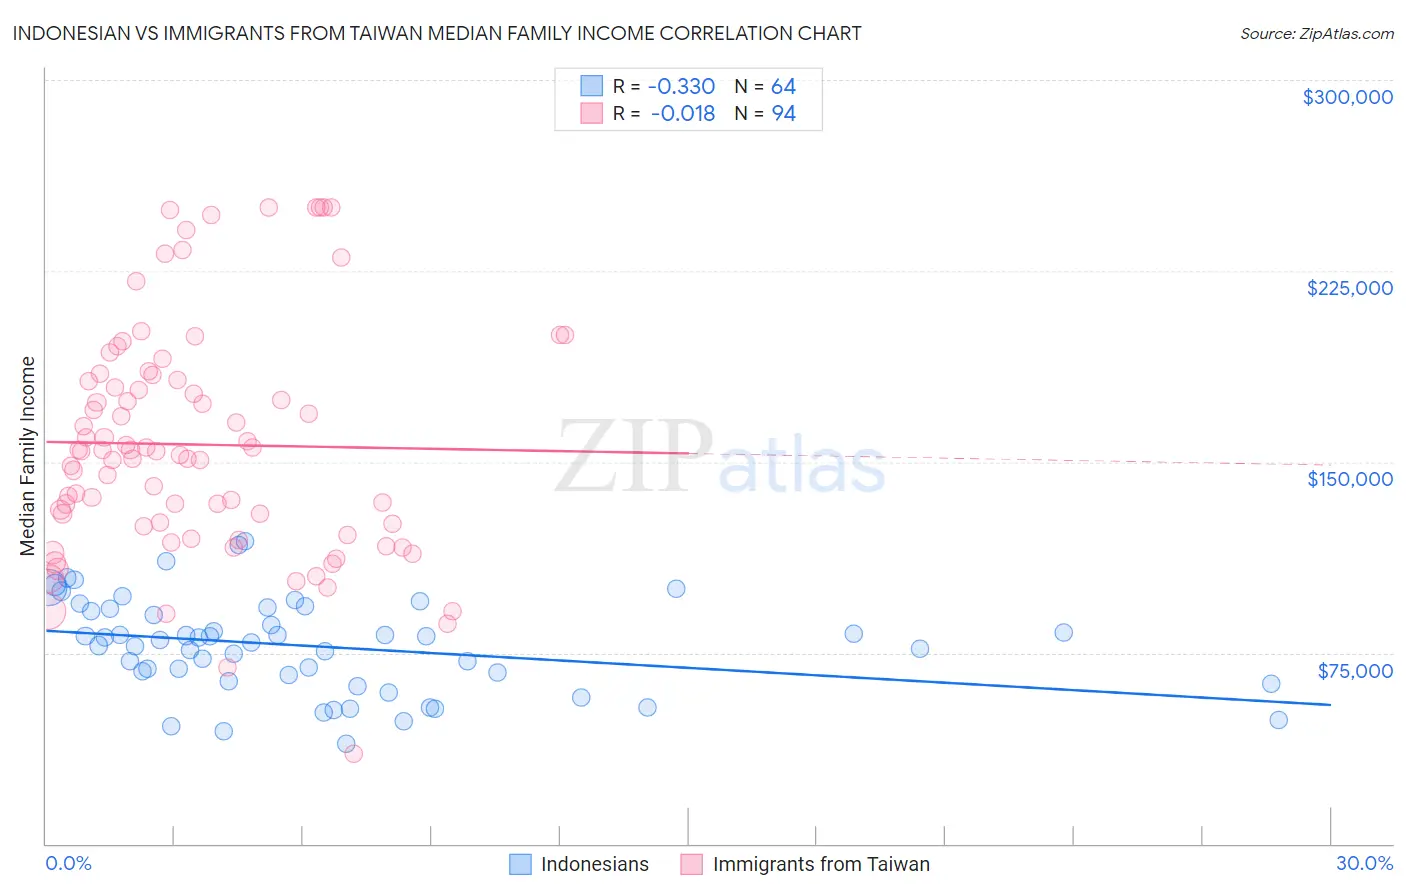
Indonesian vs Immigrants from Taiwan Median Family Income Correlation Chart
The statistical analysis conducted on geographies consisting of 162,594,892 people shows a mild negative correlation between the proportion of Indonesians and median family income in the United States with a correlation coefficient (R) of -0.330 and weighted average of $88,301. Similarly, the statistical analysis conducted on geographies consisting of 298,070,874 people shows no correlation between the proportion of Immigrants from Taiwan and median family income in the United States with a correlation coefficient (R) of -0.018 and weighted average of $136,949, a difference of 55.1%.
Median Family Income Correlation Summary
| Measurement | Indonesian | Immigrants from Taiwan |
| Minimum | $39,136 | $35,382 |
| Maximum | $118,875 | $250,001 |
| Range | $79,739 | $214,619 |
| Mean | $77,501 | $156,781 |
| Median | $79,746 | $154,299 |
| Interquartile 25% (IQ1) | $64,843 | $124,773 |
| Interquartile 75% (IQ3) | $91,846 | $182,305 |
| Interquartile Range (IQR) | $27,003 | $57,532 |
| Standard Deviation (Sample) | $18,499 | $45,464 |
| Standard Deviation (Population) | $18,353 | $45,222 |
Similar Demographics by Median Family Income
Demographics Similar to Indonesians by Median Family Income
In terms of median family income, the demographic groups most similar to Indonesians are Guatemalan ($88,295, a difference of 0.010%), Immigrants from Nicaragua ($88,267, a difference of 0.040%), Potawatomi ($88,265, a difference of 0.040%), Bangladeshi ($88,358, a difference of 0.060%), and Cherokee ($88,209, a difference of 0.10%).
| Demographics | Rating | Rank | Median Family Income |
| Immigrants | Jamaica | 0.1 /100 | #277 | Tragic $89,268 |
| Immigrants | Grenada | 0.1 /100 | #278 | Tragic $89,249 |
| Immigrants | Belize | 0.1 /100 | #279 | Tragic $89,197 |
| British West Indians | 0.1 /100 | #280 | Tragic $88,987 |
| Blackfeet | 0.1 /100 | #281 | Tragic $88,717 |
| Comanche | 0.1 /100 | #282 | Tragic $88,556 |
| Bangladeshis | 0.1 /100 | #283 | Tragic $88,358 |
| Indonesians | 0.1 /100 | #284 | Tragic $88,301 |
| Guatemalans | 0.1 /100 | #285 | Tragic $88,295 |
| Immigrants | Nicaragua | 0.1 /100 | #286 | Tragic $88,267 |
| Potawatomi | 0.1 /100 | #287 | Tragic $88,265 |
| Cherokee | 0.1 /100 | #288 | Tragic $88,209 |
| Central American Indians | 0.1 /100 | #289 | Tragic $88,034 |
| Shoshone | 0.1 /100 | #290 | Tragic $87,872 |
| Immigrants | Cabo Verde | 0.1 /100 | #291 | Tragic $87,830 |
Demographics Similar to Immigrants from Taiwan by Median Family Income
In terms of median family income, the demographic groups most similar to Immigrants from Taiwan are Filipino ($138,397, a difference of 1.1%), Immigrants from Singapore ($134,818, a difference of 1.6%), Immigrants from India ($134,028, a difference of 2.2%), Iranian ($133,839, a difference of 2.3%), and Thai ($131,281, a difference of 4.3%).
| Demographics | Rating | Rank | Median Family Income |
| Filipinos | 100.0 /100 | #1 | Exceptional $138,397 |
| Immigrants | Taiwan | 100.0 /100 | #2 | Exceptional $136,949 |
| Immigrants | Singapore | 100.0 /100 | #3 | Exceptional $134,818 |
| Immigrants | India | 100.0 /100 | #4 | Exceptional $134,028 |
| Iranians | 100.0 /100 | #5 | Exceptional $133,839 |
| Thais | 100.0 /100 | #6 | Exceptional $131,281 |
| Immigrants | Hong Kong | 100.0 /100 | #7 | Exceptional $131,067 |
| Immigrants | Iran | 100.0 /100 | #8 | Exceptional $130,894 |
| Okinawans | 100.0 /100 | #9 | Exceptional $129,979 |
| Immigrants | Ireland | 100.0 /100 | #10 | Exceptional $127,584 |
| Immigrants | Israel | 100.0 /100 | #11 | Exceptional $127,430 |
| Cypriots | 100.0 /100 | #12 | Exceptional $127,064 |
| Immigrants | Australia | 100.0 /100 | #13 | Exceptional $126,620 |
| Immigrants | South Central Asia | 100.0 /100 | #14 | Exceptional $125,956 |
| Eastern Europeans | 100.0 /100 | #15 | Exceptional $125,546 |