Crow vs Immigrants from Poland Unemployment Among Seniors over 65 years
COMPARE
Crow
Immigrants from Poland
Unemployment Among Seniors over 65 years
Unemployment Among Seniors over 65 years Comparison
Crow
Immigrants from Poland
16.9%
UNEMPLOYMENT AMONG SENIORS OVER 65 YEARS
0.0/ 100
METRIC RATING
347th/ 347
METRIC RANK
5.2%
UNEMPLOYMENT AMONG SENIORS OVER 65 YEARS
24.3/ 100
METRIC RATING
196th/ 347
METRIC RANK
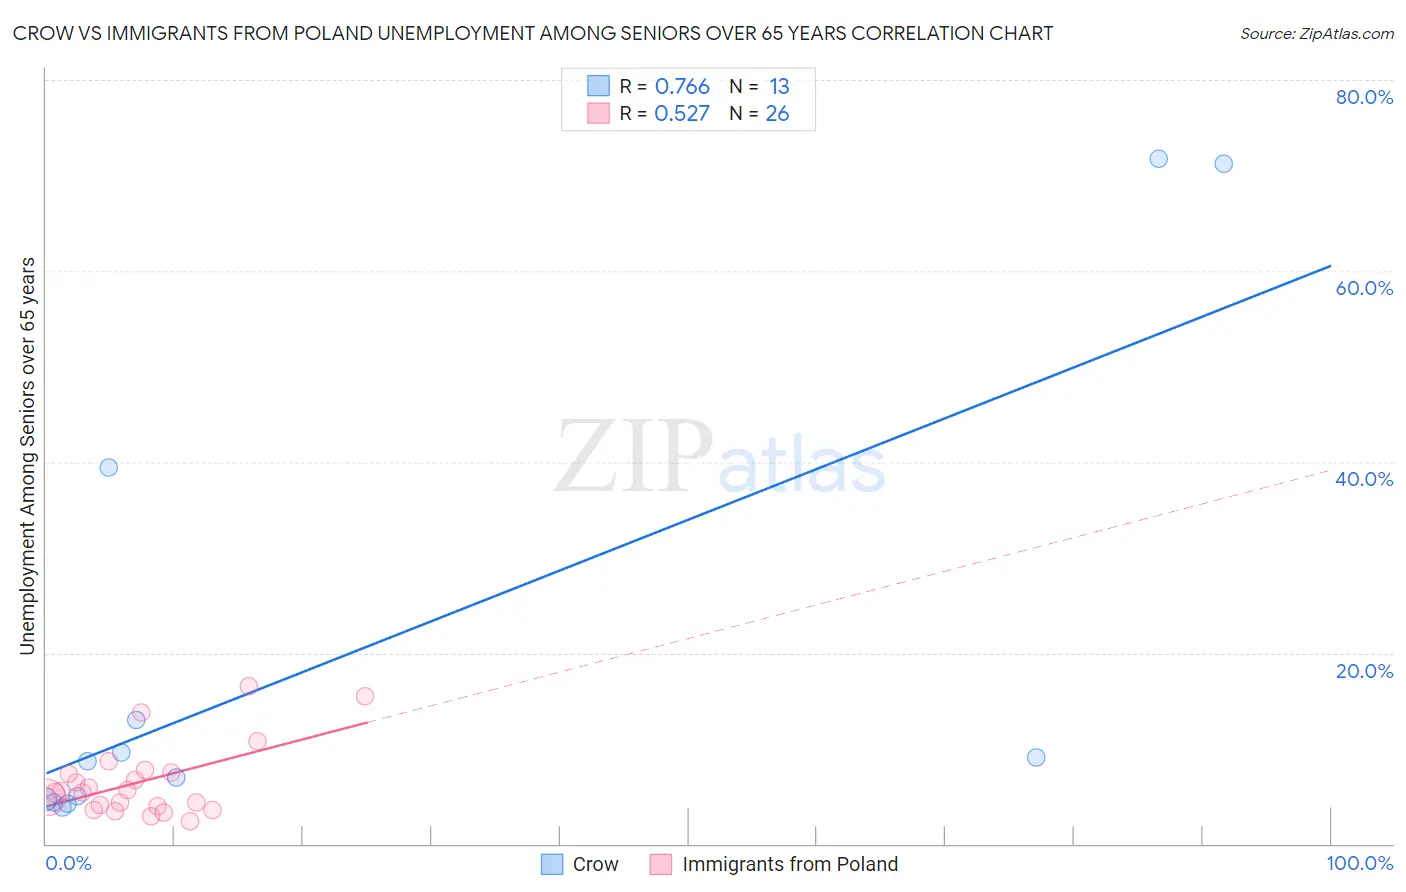
Crow vs Immigrants from Poland Unemployment Among Seniors over 65 years Correlation Chart
The statistical analysis conducted on geographies consisting of 56,531,243 people shows a strong positive correlation between the proportion of Crow and unemployment rate amomg seniors over the age of 65 in the United States with a correlation coefficient (R) of 0.766 and weighted average of 16.9%. Similarly, the statistical analysis conducted on geographies consisting of 282,698,124 people shows a substantial positive correlation between the proportion of Immigrants from Poland and unemployment rate amomg seniors over the age of 65 in the United States with a correlation coefficient (R) of 0.527 and weighted average of 5.2%, a difference of 224.6%.
Unemployment Among Seniors over 65 years Correlation Summary
| Measurement | Crow | Immigrants from Poland |
| Minimum | 3.7% | 2.4% |
| Maximum | 71.7% | 16.5% |
| Range | 68.0% | 14.1% |
| Mean | 19.3% | 6.5% |
| Median | 8.7% | 5.4% |
| Interquartile 25% (IQ1) | 4.5% | 4.0% |
| Interquartile 75% (IQ3) | 26.2% | 7.5% |
| Interquartile Range (IQR) | 21.7% | 3.5% |
| Standard Deviation (Sample) | 24.9% | 3.8% |
| Standard Deviation (Population) | 24.0% | 3.7% |
Similar Demographics by Unemployment Among Seniors over 65 years
Demographics Similar to Crow by Unemployment Among Seniors over 65 years
In terms of unemployment among seniors over 65 years, the demographic groups most similar to Crow are Yup'ik (9.1%, a difference of 84.6%), Immigrants from Yemen (8.2%, a difference of 105.7%), Alaskan Athabascan (7.0%, a difference of 139.3%), Tlingit-Haida (6.8%, a difference of 148.3%), and Navajo (6.7%, a difference of 151.5%).
| Demographics | Rating | Rank | Unemployment Among Seniors over 65 years |
| Immigrants | Dominican Republic | 0.0 /100 | #333 | Tragic 6.0% |
| Tohono O'odham | 0.0 /100 | #334 | Tragic 6.1% |
| Immigrants | Armenia | 0.0 /100 | #335 | Tragic 6.2% |
| Pima | 0.0 /100 | #336 | Tragic 6.3% |
| Alaska Natives | 0.0 /100 | #337 | Tragic 6.3% |
| Immigrants | Azores | 0.0 /100 | #338 | Tragic 6.3% |
| Paiute | 0.0 /100 | #339 | Tragic 6.3% |
| Ute | 0.0 /100 | #340 | Tragic 6.3% |
| Yakama | 0.0 /100 | #341 | Tragic 6.7% |
| Navajo | 0.0 /100 | #342 | Tragic 6.7% |
| Tlingit-Haida | 0.0 /100 | #343 | Tragic 6.8% |
| Alaskan Athabascans | 0.0 /100 | #344 | Tragic 7.0% |
| Immigrants | Yemen | 0.0 /100 | #345 | Tragic 8.2% |
| Yup'ik | 0.0 /100 | #346 | Tragic 9.1% |
| Crow | 0.0 /100 | #347 | Tragic 16.9% |
Demographics Similar to Immigrants from Poland by Unemployment Among Seniors over 65 years
In terms of unemployment among seniors over 65 years, the demographic groups most similar to Immigrants from Poland are Guamanian/Chamorro (5.2%, a difference of 0.080%), Costa Rican (5.2%, a difference of 0.11%), Argentinean (5.2%, a difference of 0.19%), Immigrants from Africa (5.2%, a difference of 0.21%), and Maltese (5.2%, a difference of 0.22%).
| Demographics | Rating | Rank | Unemployment Among Seniors over 65 years |
| Bangladeshis | 32.3 /100 | #189 | Fair 5.2% |
| Koreans | 31.6 /100 | #190 | Fair 5.2% |
| Immigrants | Denmark | 31.0 /100 | #191 | Fair 5.2% |
| Sioux | 30.8 /100 | #192 | Fair 5.2% |
| Immigrants | Africa | 29.6 /100 | #193 | Fair 5.2% |
| Argentineans | 29.1 /100 | #194 | Fair 5.2% |
| Costa Ricans | 27.0 /100 | #195 | Fair 5.2% |
| Immigrants | Poland | 24.3 /100 | #196 | Fair 5.2% |
| Guamanians/Chamorros | 22.5 /100 | #197 | Fair 5.2% |
| Maltese | 19.6 /100 | #198 | Poor 5.2% |
| Immigrants | Europe | 19.0 /100 | #199 | Poor 5.2% |
| Immigrants | Pakistan | 18.4 /100 | #200 | Poor 5.2% |
| Laotians | 18.1 /100 | #201 | Poor 5.2% |
| Immigrants | Northern Africa | 17.7 /100 | #202 | Poor 5.2% |
| Sub-Saharan Africans | 17.1 /100 | #203 | Poor 5.2% |