Cree vs Immigrants from Zaire Wage/Income Gap
COMPARE
Cree
Immigrants from Zaire
Wage/Income Gap
Wage/Income Gap Comparison
Cree
Immigrants from Zaire
24.5%
WAGE/INCOME GAP
95.6/ 100
METRIC RATING
120th/ 347
METRIC RANK
22.3%
WAGE/INCOME GAP
100.0/ 100
METRIC RATING
55th/ 347
METRIC RANK
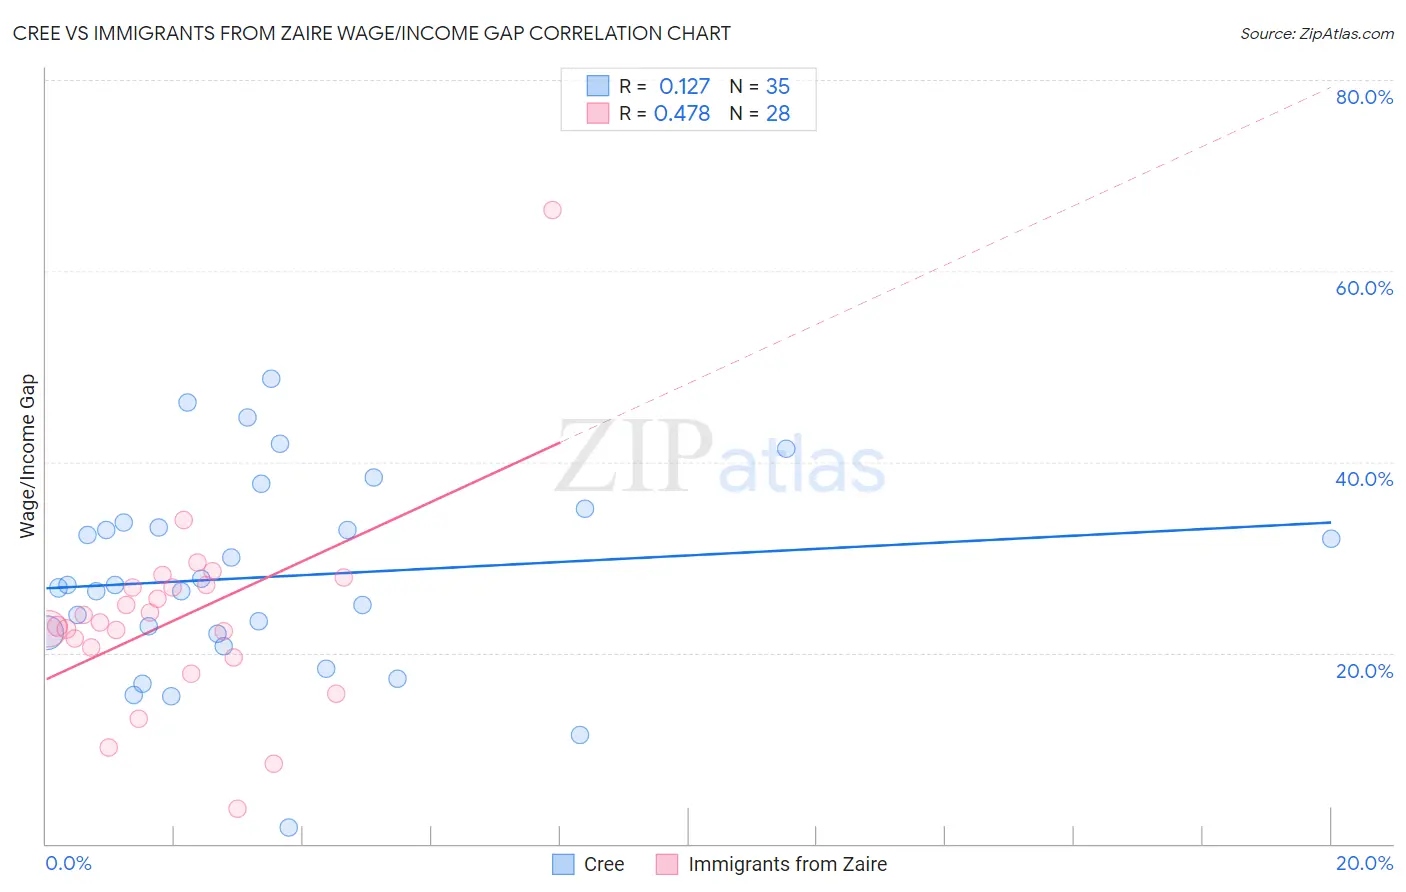
Cree vs Immigrants from Zaire Wage/Income Gap Correlation Chart
The statistical analysis conducted on geographies consisting of 76,178,665 people shows a poor positive correlation between the proportion of Cree and wage/income gap percentage in the United States with a correlation coefficient (R) of 0.127 and weighted average of 24.5%. Similarly, the statistical analysis conducted on geographies consisting of 107,239,731 people shows a moderate positive correlation between the proportion of Immigrants from Zaire and wage/income gap percentage in the United States with a correlation coefficient (R) of 0.478 and weighted average of 22.3%, a difference of 9.7%.
Wage/Income Gap Correlation Summary
| Measurement | Cree | Immigrants from Zaire |
| Minimum | 1.7% | 3.7% |
| Maximum | 48.7% | 66.4% |
| Range | 47.0% | 62.8% |
| Mean | 28.0% | 23.6% |
| Median | 27.1% | 23.0% |
| Interquartile 25% (IQ1) | 21.9% | 20.1% |
| Interquartile 75% (IQ3) | 33.6% | 27.0% |
| Interquartile Range (IQR) | 11.7% | 6.9% |
| Standard Deviation (Sample) | 10.3% | 10.8% |
| Standard Deviation (Population) | 10.2% | 10.6% |
Similar Demographics by Wage/Income Gap
Demographics Similar to Cree by Wage/Income Gap
In terms of wage/income gap, the demographic groups most similar to Cree are Kenyan (24.5%, a difference of 0.070%), Immigrants from Micronesia (24.4%, a difference of 0.090%), Immigrants from Afghanistan (24.4%, a difference of 0.13%), Alaska Native (24.4%, a difference of 0.19%), and Immigrants from Thailand (24.5%, a difference of 0.27%).
| Demographics | Rating | Rank | Wage/Income Gap |
| Sioux | 96.9 /100 | #113 | Exceptional 24.3% |
| Panamanians | 96.5 /100 | #114 | Exceptional 24.4% |
| Immigrants | Kenya | 96.4 /100 | #115 | Exceptional 24.4% |
| Alaska Natives | 96.0 /100 | #116 | Exceptional 24.4% |
| Immigrants | Afghanistan | 95.9 /100 | #117 | Exceptional 24.4% |
| Immigrants | Micronesia | 95.8 /100 | #118 | Exceptional 24.4% |
| Kenyans | 95.8 /100 | #119 | Exceptional 24.5% |
| Cree | 95.6 /100 | #120 | Exceptional 24.5% |
| Immigrants | Thailand | 94.9 /100 | #121 | Exceptional 24.5% |
| Apache | 94.8 /100 | #122 | Exceptional 24.5% |
| Natives/Alaskans | 94.6 /100 | #123 | Exceptional 24.6% |
| Immigrants | South America | 93.9 /100 | #124 | Exceptional 24.6% |
| Spanish Americans | 93.8 /100 | #125 | Exceptional 24.6% |
| Immigrants | Uruguay | 93.8 /100 | #126 | Exceptional 24.6% |
| German Russians | 93.7 /100 | #127 | Exceptional 24.6% |
Demographics Similar to Immigrants from Zaire by Wage/Income Gap
In terms of wage/income gap, the demographic groups most similar to Immigrants from Zaire are Immigrants from Ghana (22.3%, a difference of 0.030%), Ghanaian (22.3%, a difference of 0.13%), Immigrants from Cuba (22.4%, a difference of 0.22%), Navajo (22.4%, a difference of 0.25%), and Immigrants from Middle Africa (22.4%, a difference of 0.27%).
| Demographics | Rating | Rank | Wage/Income Gap |
| Blacks/African Americans | 100.0 /100 | #48 | Exceptional 21.7% |
| Ethiopians | 100.0 /100 | #49 | Exceptional 21.8% |
| Immigrants | Western Africa | 100.0 /100 | #50 | Exceptional 22.0% |
| Tohono O'odham | 100.0 /100 | #51 | Exceptional 22.1% |
| Immigrants | Cameroon | 100.0 /100 | #52 | Exceptional 22.2% |
| Bangladeshis | 100.0 /100 | #53 | Exceptional 22.2% |
| Nepalese | 100.0 /100 | #54 | Exceptional 22.2% |
| Immigrants | Zaire | 100.0 /100 | #55 | Exceptional 22.3% |
| Immigrants | Ghana | 100.0 /100 | #56 | Exceptional 22.3% |
| Ghanaians | 100.0 /100 | #57 | Exceptional 22.3% |
| Immigrants | Cuba | 100.0 /100 | #58 | Exceptional 22.4% |
| Navajo | 100.0 /100 | #59 | Exceptional 22.4% |
| Immigrants | Middle Africa | 100.0 /100 | #60 | Exceptional 22.4% |
| Immigrants | Fiji | 100.0 /100 | #61 | Exceptional 22.4% |
| Immigrants | Guatemala | 100.0 /100 | #62 | Exceptional 22.5% |