Immigrants from Congo vs Immigrants from Zaire Wage/Income Gap
COMPARE
Immigrants from Congo
Immigrants from Zaire
Wage/Income Gap
Wage/Income Gap Comparison
Immigrants from Congo
Immigrants from Zaire
21.7%
WAGE/INCOME GAP
100.0/ 100
METRIC RATING
47th/ 347
METRIC RANK
22.3%
WAGE/INCOME GAP
100.0/ 100
METRIC RATING
55th/ 347
METRIC RANK
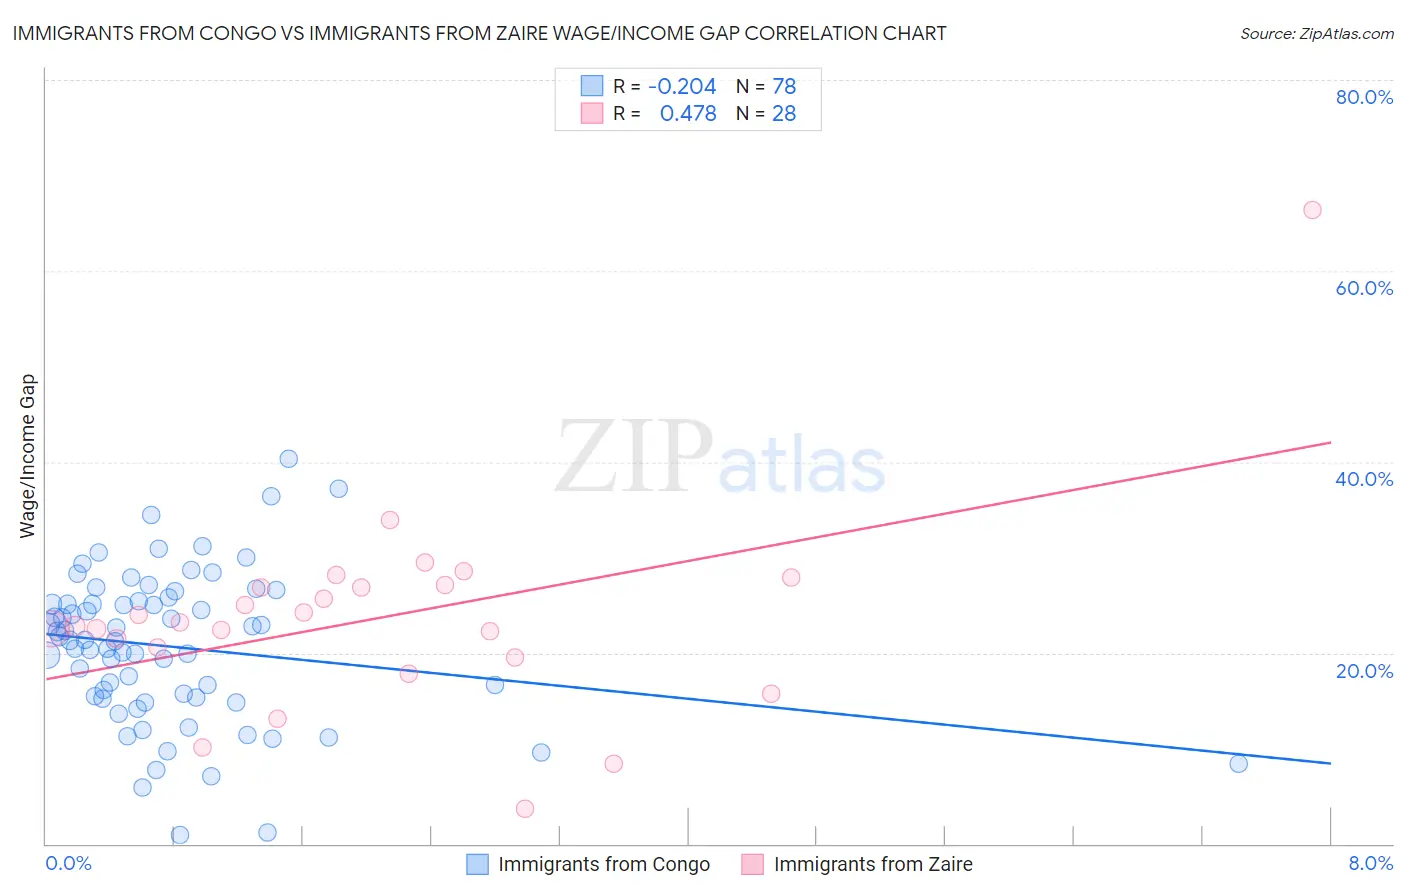
Immigrants from Congo vs Immigrants from Zaire Wage/Income Gap Correlation Chart
The statistical analysis conducted on geographies consisting of 92,125,564 people shows a weak negative correlation between the proportion of Immigrants from Congo and wage/income gap percentage in the United States with a correlation coefficient (R) of -0.204 and weighted average of 21.7%. Similarly, the statistical analysis conducted on geographies consisting of 107,239,731 people shows a moderate positive correlation between the proportion of Immigrants from Zaire and wage/income gap percentage in the United States with a correlation coefficient (R) of 0.478 and weighted average of 22.3%, a difference of 2.9%.
Wage/Income Gap Correlation Summary
| Measurement | Immigrants from Congo | Immigrants from Zaire |
| Minimum | 0.90% | 3.7% |
| Maximum | 40.3% | 66.4% |
| Range | 39.4% | 62.8% |
| Mean | 20.6% | 23.6% |
| Median | 21.3% | 23.0% |
| Interquartile 25% (IQ1) | 15.4% | 20.1% |
| Interquartile 75% (IQ3) | 25.4% | 27.0% |
| Interquartile Range (IQR) | 10.0% | 6.9% |
| Standard Deviation (Sample) | 7.9% | 10.8% |
| Standard Deviation (Population) | 7.9% | 10.6% |
Demographics Similar to Immigrants from Congo and Immigrants from Zaire by Wage/Income Gap
In terms of wage/income gap, the demographic groups most similar to Immigrants from Congo are Black/African American (21.7%, a difference of 0.18%), Immigrants from Ethiopia (21.6%, a difference of 0.55%), U.S. Virgin Islander (21.5%, a difference of 0.67%), Ethiopian (21.8%, a difference of 0.69%), and Immigrants from Eritrea (21.4%, a difference of 1.1%). Similarly, the demographic groups most similar to Immigrants from Zaire are Immigrants from Ghana (22.3%, a difference of 0.030%), Ghanaian (22.3%, a difference of 0.13%), Immigrants from Cuba (22.4%, a difference of 0.22%), Navajo (22.4%, a difference of 0.25%), and Immigrants from Middle Africa (22.4%, a difference of 0.27%).
| Demographics | Rating | Rank | Wage/Income Gap |
| Liberians | 100.0 /100 | #41 | Exceptional 21.4% |
| Immigrants | Sierra Leone | 100.0 /100 | #42 | Exceptional 21.4% |
| Sierra Leoneans | 100.0 /100 | #43 | Exceptional 21.4% |
| Immigrants | Eritrea | 100.0 /100 | #44 | Exceptional 21.4% |
| U.S. Virgin Islanders | 100.0 /100 | #45 | Exceptional 21.5% |
| Immigrants | Ethiopia | 100.0 /100 | #46 | Exceptional 21.6% |
| Immigrants | Congo | 100.0 /100 | #47 | Exceptional 21.7% |
| Blacks/African Americans | 100.0 /100 | #48 | Exceptional 21.7% |
| Ethiopians | 100.0 /100 | #49 | Exceptional 21.8% |
| Immigrants | Western Africa | 100.0 /100 | #50 | Exceptional 22.0% |
| Tohono O'odham | 100.0 /100 | #51 | Exceptional 22.1% |
| Immigrants | Cameroon | 100.0 /100 | #52 | Exceptional 22.2% |
| Bangladeshis | 100.0 /100 | #53 | Exceptional 22.2% |
| Nepalese | 100.0 /100 | #54 | Exceptional 22.2% |
| Immigrants | Zaire | 100.0 /100 | #55 | Exceptional 22.3% |
| Immigrants | Ghana | 100.0 /100 | #56 | Exceptional 22.3% |
| Ghanaians | 100.0 /100 | #57 | Exceptional 22.3% |
| Immigrants | Cuba | 100.0 /100 | #58 | Exceptional 22.4% |
| Navajo | 100.0 /100 | #59 | Exceptional 22.4% |
| Immigrants | Middle Africa | 100.0 /100 | #60 | Exceptional 22.4% |
| Immigrants | Fiji | 100.0 /100 | #61 | Exceptional 22.4% |