Cree vs Immigrants from Jordan Wage/Income Gap
COMPARE
Cree
Immigrants from Jordan
Wage/Income Gap
Wage/Income Gap Comparison
Cree
Immigrants from Jordan
24.5%
WAGE/INCOME GAP
95.6/ 100
METRIC RATING
120th/ 347
METRIC RANK
26.3%
WAGE/INCOME GAP
22.4/ 100
METRIC RATING
193rd/ 347
METRIC RANK
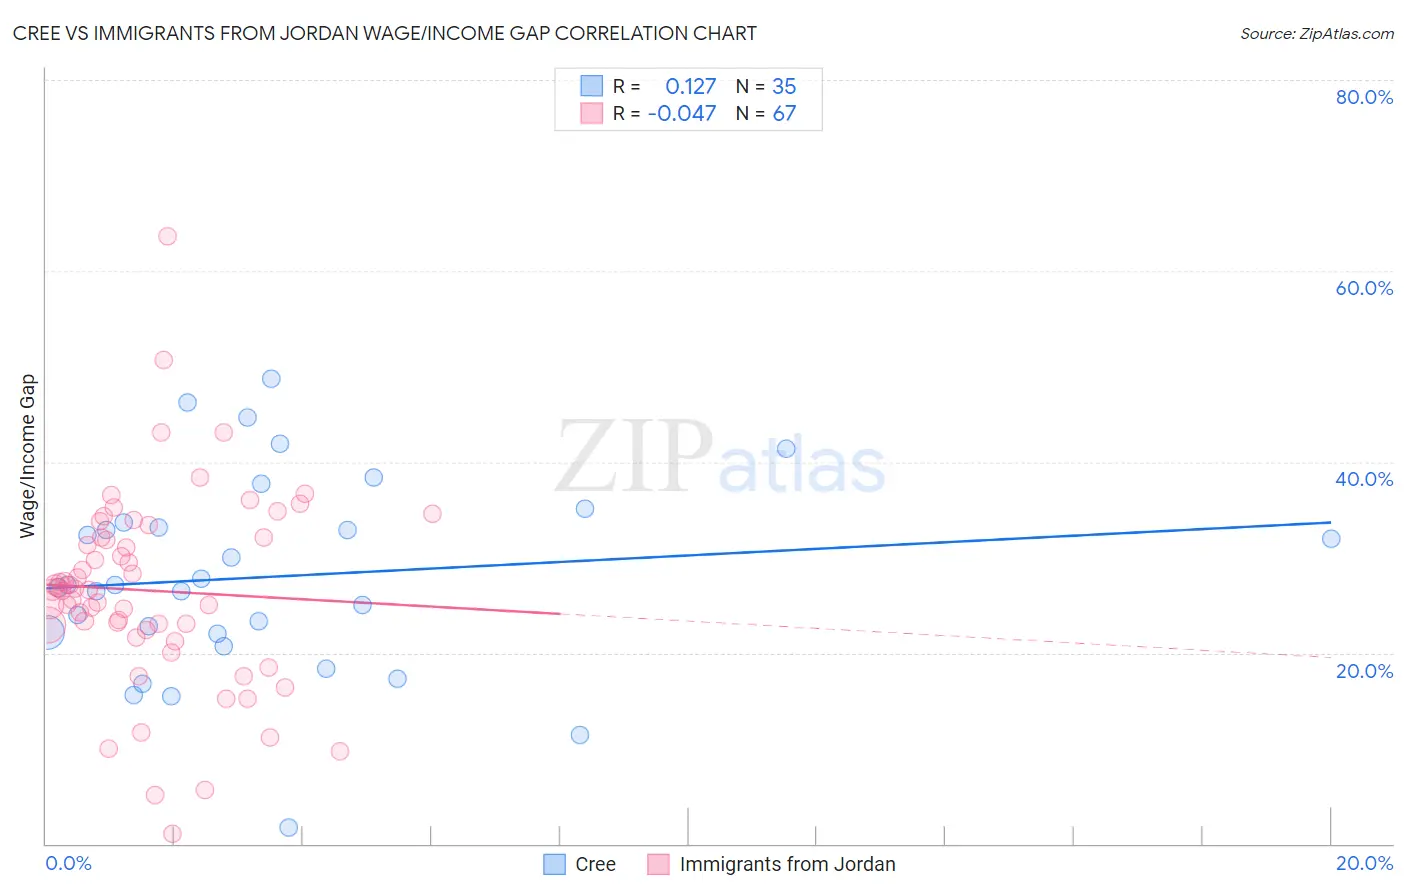
Cree vs Immigrants from Jordan Wage/Income Gap Correlation Chart
The statistical analysis conducted on geographies consisting of 76,178,665 people shows a poor positive correlation between the proportion of Cree and wage/income gap percentage in the United States with a correlation coefficient (R) of 0.127 and weighted average of 24.5%. Similarly, the statistical analysis conducted on geographies consisting of 181,259,596 people shows no correlation between the proportion of Immigrants from Jordan and wage/income gap percentage in the United States with a correlation coefficient (R) of -0.047 and weighted average of 26.3%, a difference of 7.4%.
Wage/Income Gap Correlation Summary
| Measurement | Cree | Immigrants from Jordan |
| Minimum | 1.7% | 1.1% |
| Maximum | 48.7% | 63.6% |
| Range | 47.0% | 62.5% |
| Mean | 28.0% | 26.5% |
| Median | 27.1% | 26.6% |
| Interquartile 25% (IQ1) | 21.9% | 22.3% |
| Interquartile 75% (IQ3) | 33.6% | 32.1% |
| Interquartile Range (IQR) | 11.7% | 9.7% |
| Standard Deviation (Sample) | 10.3% | 10.3% |
| Standard Deviation (Population) | 10.2% | 10.2% |
Similar Demographics by Wage/Income Gap
Demographics Similar to Cree by Wage/Income Gap
In terms of wage/income gap, the demographic groups most similar to Cree are Kenyan (24.5%, a difference of 0.070%), Immigrants from Micronesia (24.4%, a difference of 0.090%), Immigrants from Afghanistan (24.4%, a difference of 0.13%), Alaska Native (24.4%, a difference of 0.19%), and Immigrants from Thailand (24.5%, a difference of 0.27%).
| Demographics | Rating | Rank | Wage/Income Gap |
| Sioux | 96.9 /100 | #113 | Exceptional 24.3% |
| Panamanians | 96.5 /100 | #114 | Exceptional 24.4% |
| Immigrants | Kenya | 96.4 /100 | #115 | Exceptional 24.4% |
| Alaska Natives | 96.0 /100 | #116 | Exceptional 24.4% |
| Immigrants | Afghanistan | 95.9 /100 | #117 | Exceptional 24.4% |
| Immigrants | Micronesia | 95.8 /100 | #118 | Exceptional 24.4% |
| Kenyans | 95.8 /100 | #119 | Exceptional 24.5% |
| Cree | 95.6 /100 | #120 | Exceptional 24.5% |
| Immigrants | Thailand | 94.9 /100 | #121 | Exceptional 24.5% |
| Apache | 94.8 /100 | #122 | Exceptional 24.5% |
| Natives/Alaskans | 94.6 /100 | #123 | Exceptional 24.6% |
| Immigrants | South America | 93.9 /100 | #124 | Exceptional 24.6% |
| Spanish Americans | 93.8 /100 | #125 | Exceptional 24.6% |
| Immigrants | Uruguay | 93.8 /100 | #126 | Exceptional 24.6% |
| German Russians | 93.7 /100 | #127 | Exceptional 24.6% |
Demographics Similar to Immigrants from Jordan by Wage/Income Gap
In terms of wage/income gap, the demographic groups most similar to Immigrants from Jordan are Chilean (26.3%, a difference of 0.0%), Immigrants from Bulgaria (26.3%, a difference of 0.020%), Immigrants from Malaysia (26.3%, a difference of 0.020%), Immigrants from Western Asia (26.3%, a difference of 0.060%), and Zimbabwean (26.3%, a difference of 0.070%).
| Demographics | Rating | Rank | Wage/Income Gap |
| Immigrants | Indonesia | 32.5 /100 | #186 | Fair 26.1% |
| Palestinians | 29.9 /100 | #187 | Fair 26.1% |
| Immigrants | Egypt | 29.9 /100 | #188 | Fair 26.1% |
| Immigrants | Moldova | 26.6 /100 | #189 | Fair 26.2% |
| Immigrants | Croatia | 24.8 /100 | #190 | Fair 26.2% |
| Immigrants | Venezuela | 24.7 /100 | #191 | Fair 26.2% |
| Immigrants | Bulgaria | 22.5 /100 | #192 | Fair 26.3% |
| Immigrants | Jordan | 22.4 /100 | #193 | Fair 26.3% |
| Chileans | 22.3 /100 | #194 | Fair 26.3% |
| Immigrants | Malaysia | 22.2 /100 | #195 | Fair 26.3% |
| Immigrants | Western Asia | 21.7 /100 | #196 | Fair 26.3% |
| Zimbabweans | 21.6 /100 | #197 | Fair 26.3% |
| Venezuelans | 21.5 /100 | #198 | Fair 26.3% |
| Dutch West Indians | 21.0 /100 | #199 | Fair 26.3% |
| Delaware | 20.9 /100 | #200 | Fair 26.3% |