Cree vs Immigrants from Zaire Male Poverty
COMPARE
Cree
Immigrants from Zaire
Male Poverty
Male Poverty Comparison
Cree
Immigrants from Zaire
13.3%
MALE POVERTY
0.0/ 100
METRIC RATING
270th/ 347
METRIC RANK
13.8%
MALE POVERTY
0.0/ 100
METRIC RATING
290th/ 347
METRIC RANK
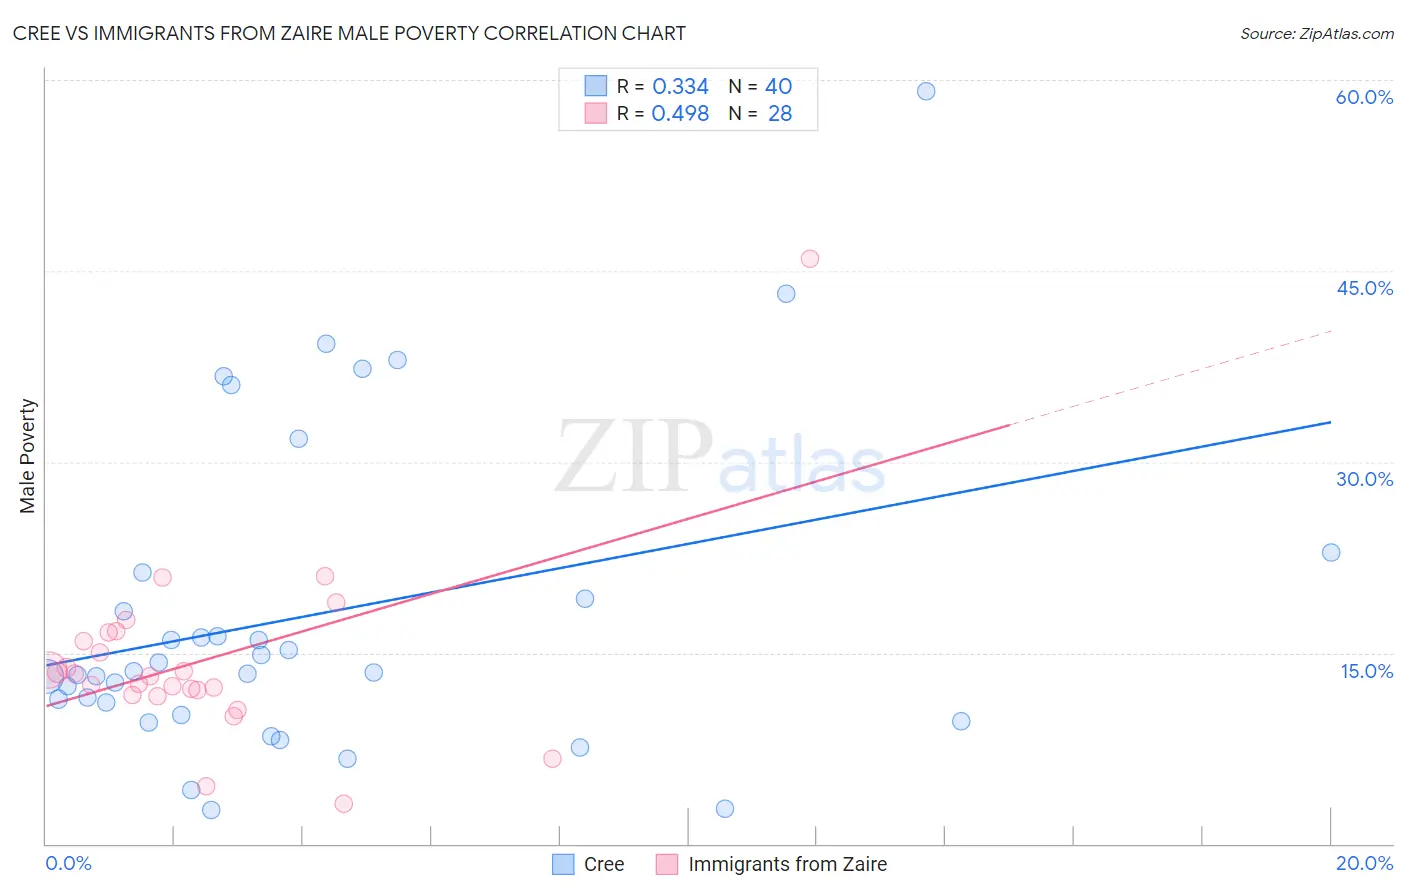
Cree vs Immigrants from Zaire Male Poverty Correlation Chart
The statistical analysis conducted on geographies consisting of 76,204,291 people shows a mild positive correlation between the proportion of Cree and poverty level among males in the United States with a correlation coefficient (R) of 0.334 and weighted average of 13.3%. Similarly, the statistical analysis conducted on geographies consisting of 107,236,252 people shows a moderate positive correlation between the proportion of Immigrants from Zaire and poverty level among males in the United States with a correlation coefficient (R) of 0.498 and weighted average of 13.8%, a difference of 3.5%.
Male Poverty Correlation Summary
| Measurement | Cree | Immigrants from Zaire |
| Minimum | 2.7% | 3.1% |
| Maximum | 59.1% | 45.9% |
| Range | 56.4% | 42.8% |
| Mean | 18.0% | 14.3% |
| Median | 13.5% | 13.3% |
| Interquartile 25% (IQ1) | 10.6% | 11.9% |
| Interquartile 75% (IQ3) | 20.2% | 16.3% |
| Interquartile Range (IQR) | 9.6% | 4.4% |
| Standard Deviation (Sample) | 12.5% | 7.4% |
| Standard Deviation (Population) | 12.4% | 7.3% |
Demographics Similar to Cree and Immigrants from Zaire by Male Poverty
In terms of male poverty, the demographic groups most similar to Cree are Spanish American (13.4%, a difference of 0.030%), Immigrants from Bahamas (13.5%, a difference of 0.78%), Chickasaw (13.5%, a difference of 1.1%), Immigrants from West Indies (13.5%, a difference of 1.1%), and Barbadian (13.6%, a difference of 1.8%). Similarly, the demographic groups most similar to Immigrants from Zaire are Guatemalan (13.8%, a difference of 0.010%), Immigrants from St. Vincent and the Grenadines (13.8%, a difference of 0.18%), Immigrants from Barbados (13.8%, a difference of 0.35%), Shoshone (13.8%, a difference of 0.37%), and West Indian (13.8%, a difference of 0.40%).
| Demographics | Rating | Rank | Male Poverty |
| Cree | 0.0 /100 | #270 | Tragic 13.3% |
| Spanish Americans | 0.0 /100 | #271 | Tragic 13.4% |
| Immigrants | Bahamas | 0.0 /100 | #272 | Tragic 13.5% |
| Chickasaw | 0.0 /100 | #273 | Tragic 13.5% |
| Immigrants | West Indies | 0.0 /100 | #274 | Tragic 13.5% |
| Barbadians | 0.0 /100 | #275 | Tragic 13.6% |
| Immigrants | Latin America | 0.0 /100 | #276 | Tragic 13.6% |
| Bangladeshis | 0.0 /100 | #277 | Tragic 13.6% |
| Belizeans | 0.0 /100 | #278 | Tragic 13.6% |
| Haitians | 0.0 /100 | #279 | Tragic 13.7% |
| Mexicans | 0.0 /100 | #280 | Tragic 13.7% |
| Yaqui | 0.0 /100 | #281 | Tragic 13.7% |
| Immigrants | Cabo Verde | 0.0 /100 | #282 | Tragic 13.7% |
| Comanche | 0.0 /100 | #283 | Tragic 13.8% |
| Immigrants | Haiti | 0.0 /100 | #284 | Tragic 13.8% |
| West Indians | 0.0 /100 | #285 | Tragic 13.8% |
| Shoshone | 0.0 /100 | #286 | Tragic 13.8% |
| Immigrants | Barbados | 0.0 /100 | #287 | Tragic 13.8% |
| Immigrants | St. Vincent and the Grenadines | 0.0 /100 | #288 | Tragic 13.8% |
| Guatemalans | 0.0 /100 | #289 | Tragic 13.8% |
| Immigrants | Zaire | 0.0 /100 | #290 | Tragic 13.8% |