Cambodian vs Immigrants from Ecuador Median Female Earnings
COMPARE
Cambodian
Immigrants from Ecuador
Median Female Earnings
Median Female Earnings Comparison
Cambodians
Immigrants from Ecuador
$45,014
MEDIAN FEMALE EARNINGS
100.0/ 100
METRIC RATING
21st/ 347
METRIC RANK
$38,644
MEDIAN FEMALE EARNINGS
10.1/ 100
METRIC RATING
216th/ 347
METRIC RANK
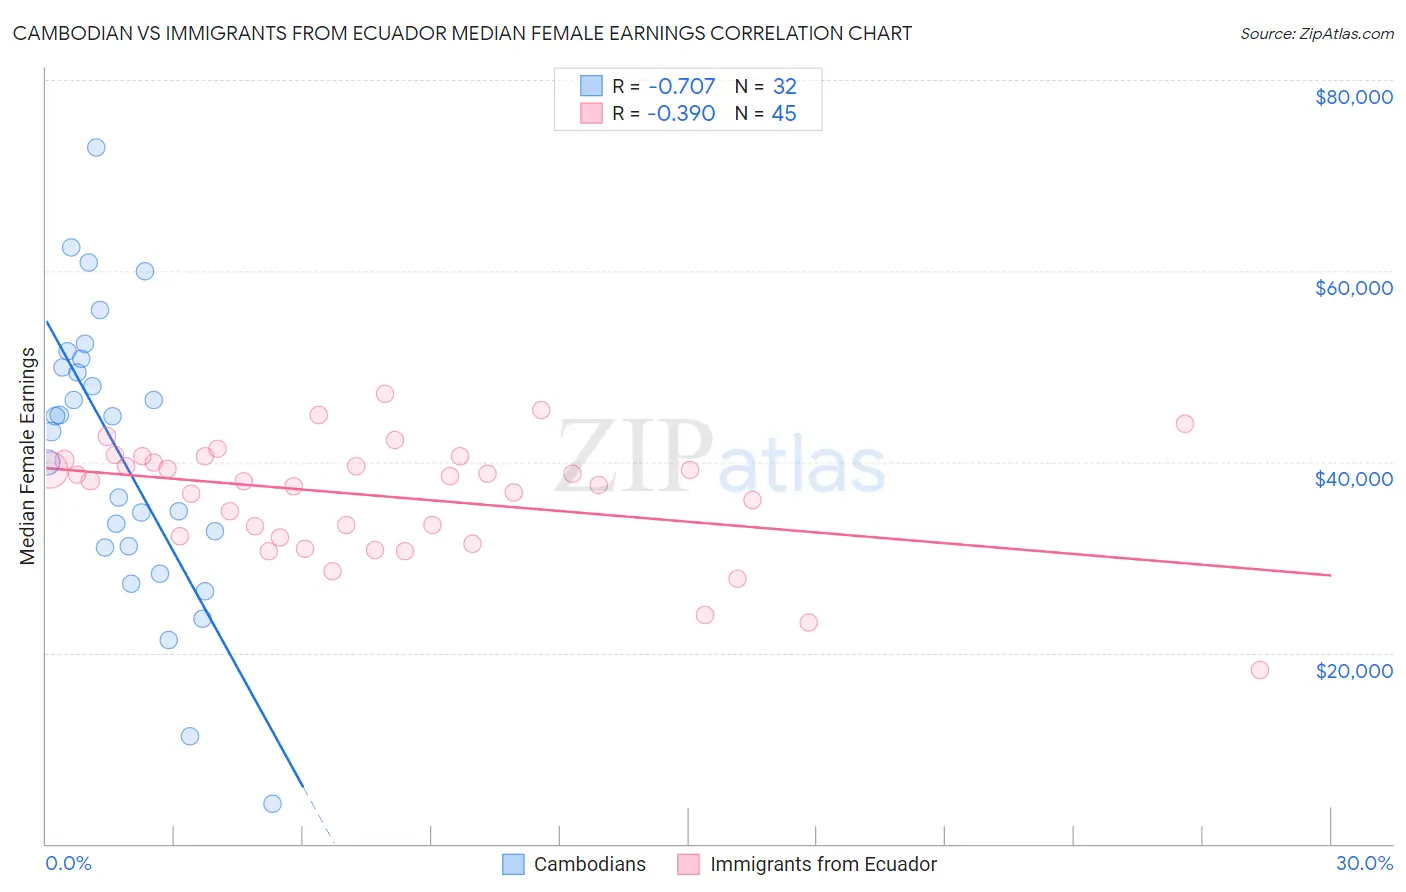
Cambodian vs Immigrants from Ecuador Median Female Earnings Correlation Chart
The statistical analysis conducted on geographies consisting of 102,513,966 people shows a strong negative correlation between the proportion of Cambodians and median female earnings in the United States with a correlation coefficient (R) of -0.707 and weighted average of $45,014. Similarly, the statistical analysis conducted on geographies consisting of 270,943,793 people shows a mild negative correlation between the proportion of Immigrants from Ecuador and median female earnings in the United States with a correlation coefficient (R) of -0.390 and weighted average of $38,644, a difference of 16.5%.
Median Female Earnings Correlation Summary
| Measurement | Cambodian | Immigrants from Ecuador |
| Minimum | $4,132 | $18,150 |
| Maximum | $72,888 | $47,087 |
| Range | $68,756 | $28,937 |
| Mean | $40,669 | $36,378 |
| Median | $43,973 | $37,998 |
| Interquartile 25% (IQ1) | $31,093 | $32,167 |
| Interquartile 75% (IQ3) | $50,357 | $40,357 |
| Interquartile Range (IQR) | $19,265 | $8,190 |
| Standard Deviation (Sample) | $15,041 | $6,055 |
| Standard Deviation (Population) | $14,804 | $5,987 |
Similar Demographics by Median Female Earnings
Demographics Similar to Cambodians by Median Female Earnings
In terms of median female earnings, the demographic groups most similar to Cambodians are Immigrants from Greece ($44,976, a difference of 0.080%), Burmese ($44,911, a difference of 0.23%), Immigrants from Korea ($44,847, a difference of 0.37%), Immigrants from Sweden ($44,774, a difference of 0.54%), and Immigrants from Belarus ($44,757, a difference of 0.57%).
| Demographics | Rating | Rank | Median Female Earnings |
| Soviet Union | 100.0 /100 | #14 | Exceptional $46,556 |
| Immigrants | Eastern Asia | 100.0 /100 | #15 | Exceptional $46,502 |
| Indians (Asian) | 100.0 /100 | #16 | Exceptional $46,481 |
| Immigrants | South Central Asia | 100.0 /100 | #17 | Exceptional $46,324 |
| Cypriots | 100.0 /100 | #18 | Exceptional $45,570 |
| Eastern Europeans | 100.0 /100 | #19 | Exceptional $45,385 |
| Immigrants | Japan | 100.0 /100 | #20 | Exceptional $45,323 |
| Cambodians | 100.0 /100 | #21 | Exceptional $45,014 |
| Immigrants | Greece | 100.0 /100 | #22 | Exceptional $44,976 |
| Burmese | 100.0 /100 | #23 | Exceptional $44,911 |
| Immigrants | Korea | 100.0 /100 | #24 | Exceptional $44,847 |
| Immigrants | Sweden | 100.0 /100 | #25 | Exceptional $44,774 |
| Immigrants | Belarus | 100.0 /100 | #26 | Exceptional $44,757 |
| Turks | 100.0 /100 | #27 | Exceptional $44,695 |
| Immigrants | Russia | 100.0 /100 | #28 | Exceptional $44,680 |
Demographics Similar to Immigrants from Ecuador by Median Female Earnings
In terms of median female earnings, the demographic groups most similar to Immigrants from Ecuador are Spaniard ($38,656, a difference of 0.030%), Immigrants from Jamaica ($38,625, a difference of 0.050%), Iraqi ($38,666, a difference of 0.060%), Jamaican ($38,670, a difference of 0.070%), and Cape Verdean ($38,614, a difference of 0.080%).
| Demographics | Rating | Rank | Median Female Earnings |
| Norwegians | 13.4 /100 | #209 | Poor $38,802 |
| Czechoslovakians | 12.0 /100 | #210 | Poor $38,738 |
| Aleuts | 11.6 /100 | #211 | Poor $38,719 |
| Guamanians/Chamorros | 11.5 /100 | #212 | Poor $38,717 |
| Jamaicans | 10.5 /100 | #213 | Poor $38,670 |
| Iraqis | 10.5 /100 | #214 | Poor $38,666 |
| Spaniards | 10.3 /100 | #215 | Poor $38,656 |
| Immigrants | Ecuador | 10.1 /100 | #216 | Poor $38,644 |
| Immigrants | Jamaica | 9.7 /100 | #217 | Tragic $38,625 |
| Cape Verdeans | 9.5 /100 | #218 | Tragic $38,614 |
| Nepalese | 9.3 /100 | #219 | Tragic $38,603 |
| Yugoslavians | 8.8 /100 | #220 | Tragic $38,573 |
| Immigrants | Azores | 8.8 /100 | #221 | Tragic $38,573 |
| Japanese | 8.1 /100 | #222 | Tragic $38,528 |
| Immigrants | Sudan | 7.8 /100 | #223 | Tragic $38,511 |