Immigrants from Bosnia and Herzegovina vs Immigrants from Ecuador Median Female Earnings
COMPARE
Immigrants from Bosnia and Herzegovina
Immigrants from Ecuador
Median Female Earnings
Median Female Earnings Comparison
Immigrants from Bosnia and Herzegovina
Immigrants from Ecuador
$38,886
MEDIAN FEMALE EARNINGS
15.6/ 100
METRIC RATING
206th/ 347
METRIC RANK
$38,644
MEDIAN FEMALE EARNINGS
10.1/ 100
METRIC RATING
216th/ 347
METRIC RANK
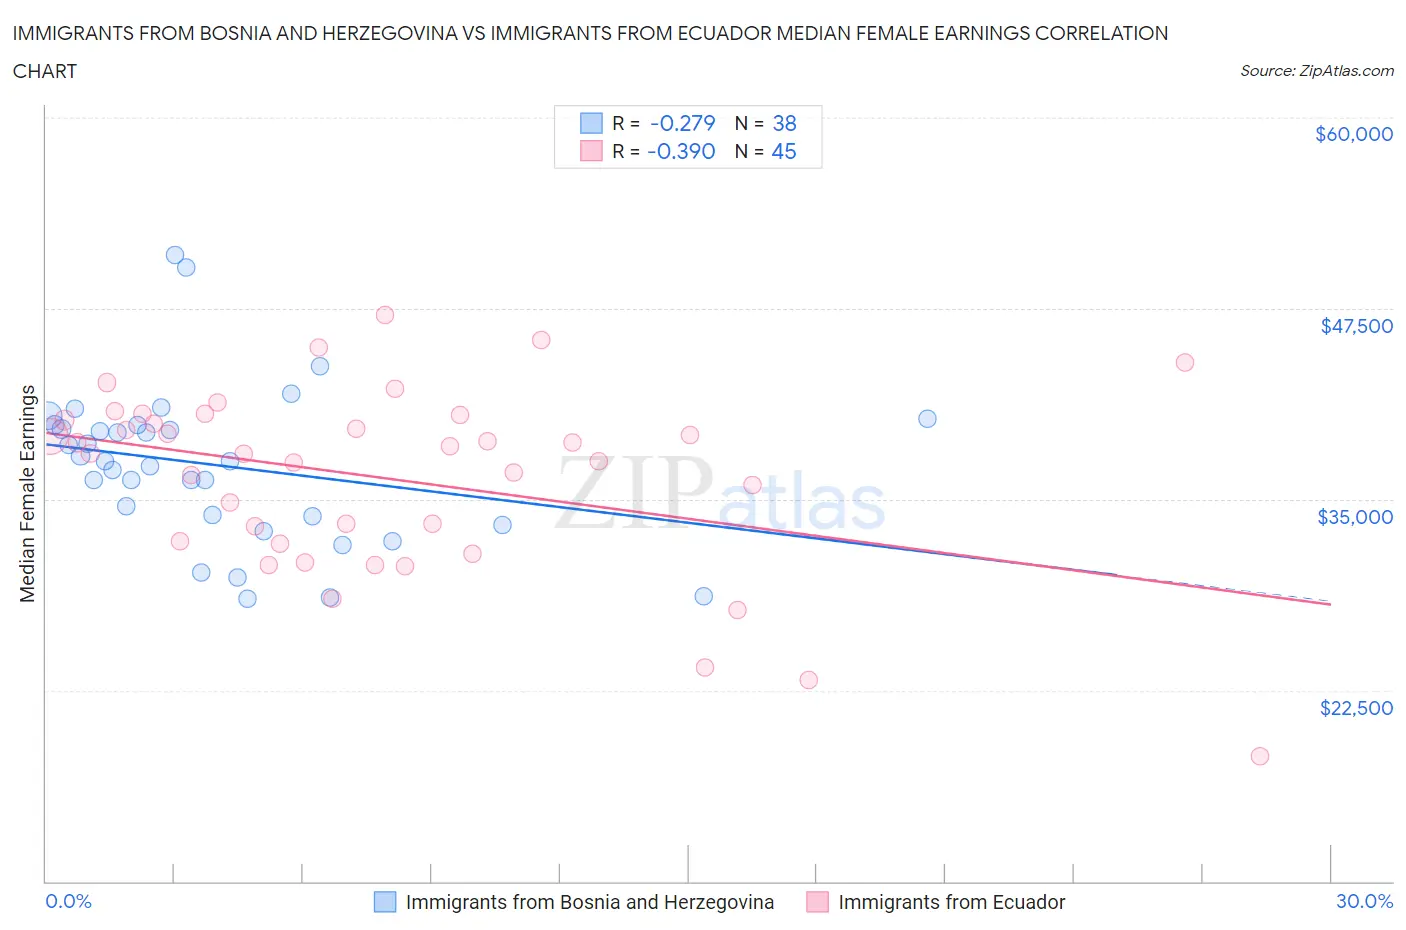
Immigrants from Bosnia and Herzegovina vs Immigrants from Ecuador Median Female Earnings Correlation Chart
The statistical analysis conducted on geographies consisting of 156,788,843 people shows a weak negative correlation between the proportion of Immigrants from Bosnia and Herzegovina and median female earnings in the United States with a correlation coefficient (R) of -0.279 and weighted average of $38,886. Similarly, the statistical analysis conducted on geographies consisting of 270,943,793 people shows a mild negative correlation between the proportion of Immigrants from Ecuador and median female earnings in the United States with a correlation coefficient (R) of -0.390 and weighted average of $38,644, a difference of 0.63%.
Median Female Earnings Correlation Summary
| Measurement | Immigrants from Bosnia and Herzegovina | Immigrants from Ecuador |
| Minimum | $28,455 | $18,150 |
| Maximum | $50,999 | $47,087 |
| Range | $22,544 | $28,937 |
| Mean | $37,228 | $36,378 |
| Median | $37,485 | $37,998 |
| Interquartile 25% (IQ1) | $33,898 | $32,167 |
| Interquartile 75% (IQ3) | $39,866 | $40,357 |
| Interquartile Range (IQR) | $5,968 | $8,190 |
| Standard Deviation (Sample) | $5,099 | $6,055 |
| Standard Deviation (Population) | $5,032 | $5,987 |
Demographics Similar to Immigrants from Bosnia and Herzegovina and Immigrants from Ecuador by Median Female Earnings
In terms of median female earnings, the demographic groups most similar to Immigrants from Bosnia and Herzegovina are Immigrants from Colombia ($38,913, a difference of 0.070%), Immigrants from Cambodia ($38,833, a difference of 0.14%), Immigrants from Uruguay ($38,945, a difference of 0.15%), Immigrants from Thailand ($38,810, a difference of 0.20%), and Norwegian ($38,802, a difference of 0.22%). Similarly, the demographic groups most similar to Immigrants from Ecuador are Spaniard ($38,656, a difference of 0.030%), Immigrants from Jamaica ($38,625, a difference of 0.050%), Iraqi ($38,666, a difference of 0.060%), Jamaican ($38,670, a difference of 0.070%), and Cape Verdean ($38,614, a difference of 0.080%).
| Demographics | Rating | Rank | Median Female Earnings |
| Panamanians | 20.6 /100 | #201 | Fair $39,049 |
| Slovaks | 19.9 /100 | #202 | Poor $39,029 |
| Czechs | 18.7 /100 | #203 | Poor $38,992 |
| Immigrants | Uruguay | 17.3 /100 | #204 | Poor $38,945 |
| Immigrants | Colombia | 16.3 /100 | #205 | Poor $38,913 |
| Immigrants | Bosnia and Herzegovina | 15.6 /100 | #206 | Poor $38,886 |
| Immigrants | Cambodia | 14.2 /100 | #207 | Poor $38,833 |
| Immigrants | Thailand | 13.6 /100 | #208 | Poor $38,810 |
| Norwegians | 13.4 /100 | #209 | Poor $38,802 |
| Czechoslovakians | 12.0 /100 | #210 | Poor $38,738 |
| Aleuts | 11.6 /100 | #211 | Poor $38,719 |
| Guamanians/Chamorros | 11.5 /100 | #212 | Poor $38,717 |
| Jamaicans | 10.5 /100 | #213 | Poor $38,670 |
| Iraqis | 10.5 /100 | #214 | Poor $38,666 |
| Spaniards | 10.3 /100 | #215 | Poor $38,656 |
| Immigrants | Ecuador | 10.1 /100 | #216 | Poor $38,644 |
| Immigrants | Jamaica | 9.7 /100 | #217 | Tragic $38,625 |
| Cape Verdeans | 9.5 /100 | #218 | Tragic $38,614 |
| Nepalese | 9.3 /100 | #219 | Tragic $38,603 |
| Yugoslavians | 8.8 /100 | #220 | Tragic $38,573 |
| Immigrants | Azores | 8.8 /100 | #221 | Tragic $38,573 |