Immigrants from Croatia vs Immigrants from Ecuador Median Female Earnings
COMPARE
Immigrants from Croatia
Immigrants from Ecuador
Median Female Earnings
Median Female Earnings Comparison
Immigrants from Croatia
Immigrants from Ecuador
$43,258
MEDIAN FEMALE EARNINGS
99.9/ 100
METRIC RATING
56th/ 347
METRIC RANK
$38,644
MEDIAN FEMALE EARNINGS
10.1/ 100
METRIC RATING
216th/ 347
METRIC RANK
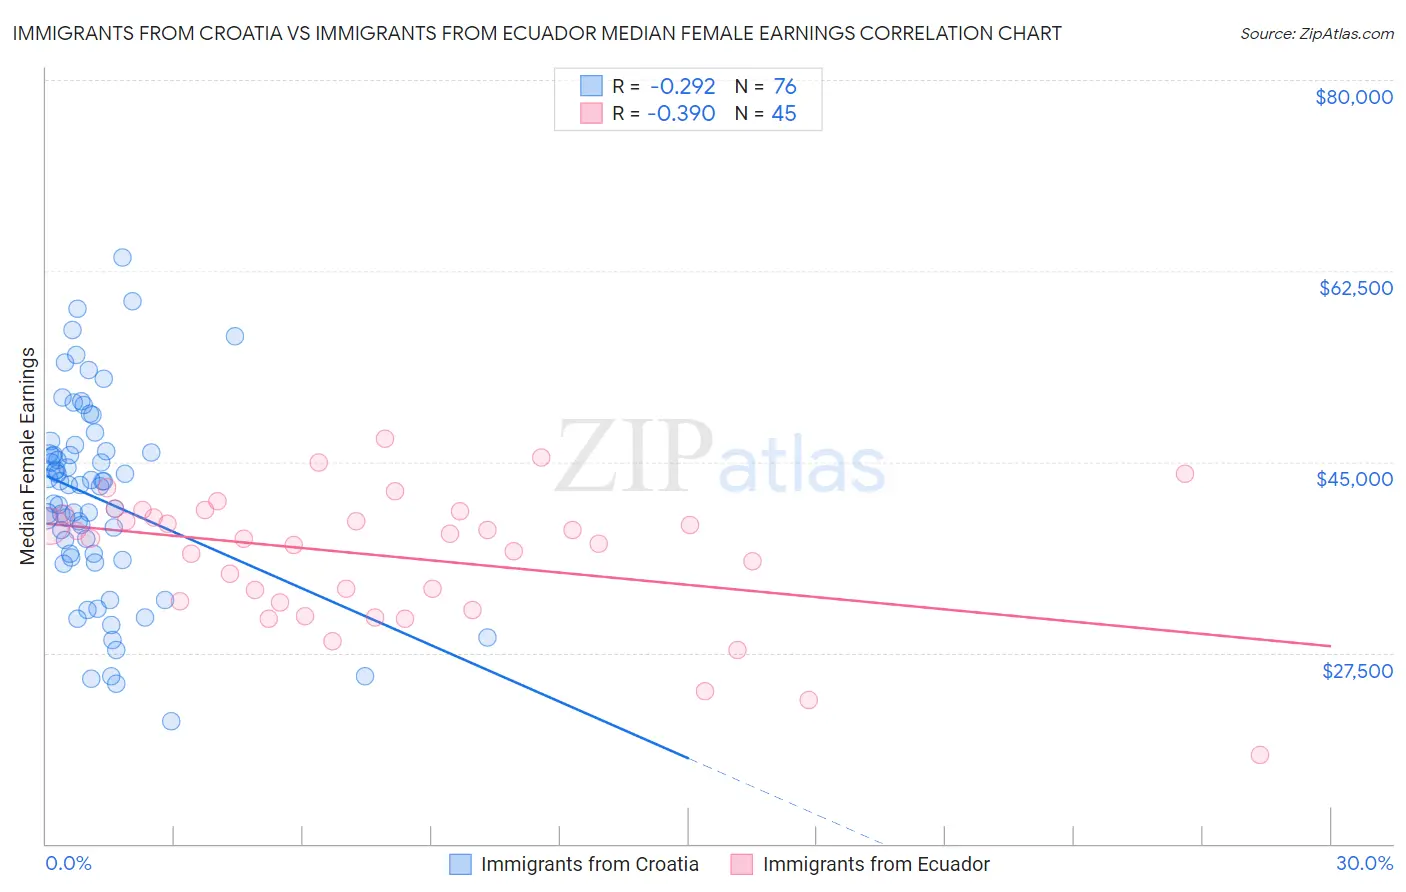
Immigrants from Croatia vs Immigrants from Ecuador Median Female Earnings Correlation Chart
The statistical analysis conducted on geographies consisting of 132,568,368 people shows a weak negative correlation between the proportion of Immigrants from Croatia and median female earnings in the United States with a correlation coefficient (R) of -0.292 and weighted average of $43,258. Similarly, the statistical analysis conducted on geographies consisting of 270,943,793 people shows a mild negative correlation between the proportion of Immigrants from Ecuador and median female earnings in the United States with a correlation coefficient (R) of -0.390 and weighted average of $38,644, a difference of 11.9%.
Median Female Earnings Correlation Summary
| Measurement | Immigrants from Croatia | Immigrants from Ecuador |
| Minimum | $21,250 | $18,150 |
| Maximum | $63,753 | $47,087 |
| Range | $42,503 | $28,937 |
| Mean | $41,680 | $36,378 |
| Median | $42,916 | $37,998 |
| Interquartile 25% (IQ1) | $36,403 | $32,167 |
| Interquartile 75% (IQ3) | $45,910 | $40,357 |
| Interquartile Range (IQR) | $9,507 | $8,190 |
| Standard Deviation (Sample) | $8,879 | $6,055 |
| Standard Deviation (Population) | $8,820 | $5,987 |
Similar Demographics by Median Female Earnings
Demographics Similar to Immigrants from Croatia by Median Female Earnings
In terms of median female earnings, the demographic groups most similar to Immigrants from Croatia are Ethiopian ($43,243, a difference of 0.040%), Australian ($43,308, a difference of 0.11%), Egyptian ($43,305, a difference of 0.11%), Immigrants from Eastern Europe ($43,309, a difference of 0.12%), and Immigrants from Lithuania ($43,317, a difference of 0.14%).
| Demographics | Rating | Rank | Median Female Earnings |
| Immigrants | Serbia | 100.0 /100 | #49 | Exceptional $43,385 |
| Immigrants | Uzbekistan | 100.0 /100 | #50 | Exceptional $43,363 |
| Maltese | 100.0 /100 | #51 | Exceptional $43,357 |
| Immigrants | Lithuania | 99.9 /100 | #52 | Exceptional $43,317 |
| Immigrants | Eastern Europe | 99.9 /100 | #53 | Exceptional $43,309 |
| Australians | 99.9 /100 | #54 | Exceptional $43,308 |
| Egyptians | 99.9 /100 | #55 | Exceptional $43,305 |
| Immigrants | Croatia | 99.9 /100 | #56 | Exceptional $43,258 |
| Ethiopians | 99.9 /100 | #57 | Exceptional $43,243 |
| Paraguayans | 99.9 /100 | #58 | Exceptional $43,173 |
| Estonians | 99.9 /100 | #59 | Exceptional $43,106 |
| Immigrants | Latvia | 99.9 /100 | #60 | Exceptional $43,099 |
| Immigrants | Bulgaria | 99.9 /100 | #61 | Exceptional $43,085 |
| Afghans | 99.9 /100 | #62 | Exceptional $43,077 |
| Immigrants | Ukraine | 99.9 /100 | #63 | Exceptional $43,069 |
Demographics Similar to Immigrants from Ecuador by Median Female Earnings
In terms of median female earnings, the demographic groups most similar to Immigrants from Ecuador are Spaniard ($38,656, a difference of 0.030%), Immigrants from Jamaica ($38,625, a difference of 0.050%), Iraqi ($38,666, a difference of 0.060%), Jamaican ($38,670, a difference of 0.070%), and Cape Verdean ($38,614, a difference of 0.080%).
| Demographics | Rating | Rank | Median Female Earnings |
| Norwegians | 13.4 /100 | #209 | Poor $38,802 |
| Czechoslovakians | 12.0 /100 | #210 | Poor $38,738 |
| Aleuts | 11.6 /100 | #211 | Poor $38,719 |
| Guamanians/Chamorros | 11.5 /100 | #212 | Poor $38,717 |
| Jamaicans | 10.5 /100 | #213 | Poor $38,670 |
| Iraqis | 10.5 /100 | #214 | Poor $38,666 |
| Spaniards | 10.3 /100 | #215 | Poor $38,656 |
| Immigrants | Ecuador | 10.1 /100 | #216 | Poor $38,644 |
| Immigrants | Jamaica | 9.7 /100 | #217 | Tragic $38,625 |
| Cape Verdeans | 9.5 /100 | #218 | Tragic $38,614 |
| Nepalese | 9.3 /100 | #219 | Tragic $38,603 |
| Yugoslavians | 8.8 /100 | #220 | Tragic $38,573 |
| Immigrants | Azores | 8.8 /100 | #221 | Tragic $38,573 |
| Japanese | 8.1 /100 | #222 | Tragic $38,528 |
| Immigrants | Sudan | 7.8 /100 | #223 | Tragic $38,511 |