Chippewa vs Immigrants from Eritrea Disability Age 18 to 34
COMPARE
Chippewa
Immigrants from Eritrea
Disability Age 18 to 34
Disability Age 18 to 34 Comparison
Chippewa
Immigrants from Eritrea
9.0%
DISABILITY AGE 18 TO 34
0.0/ 100
METRIC RATING
343rd/ 347
METRIC RANK
6.5%
DISABILITY AGE 18 TO 34
77.4/ 100
METRIC RATING
153rd/ 347
METRIC RANK
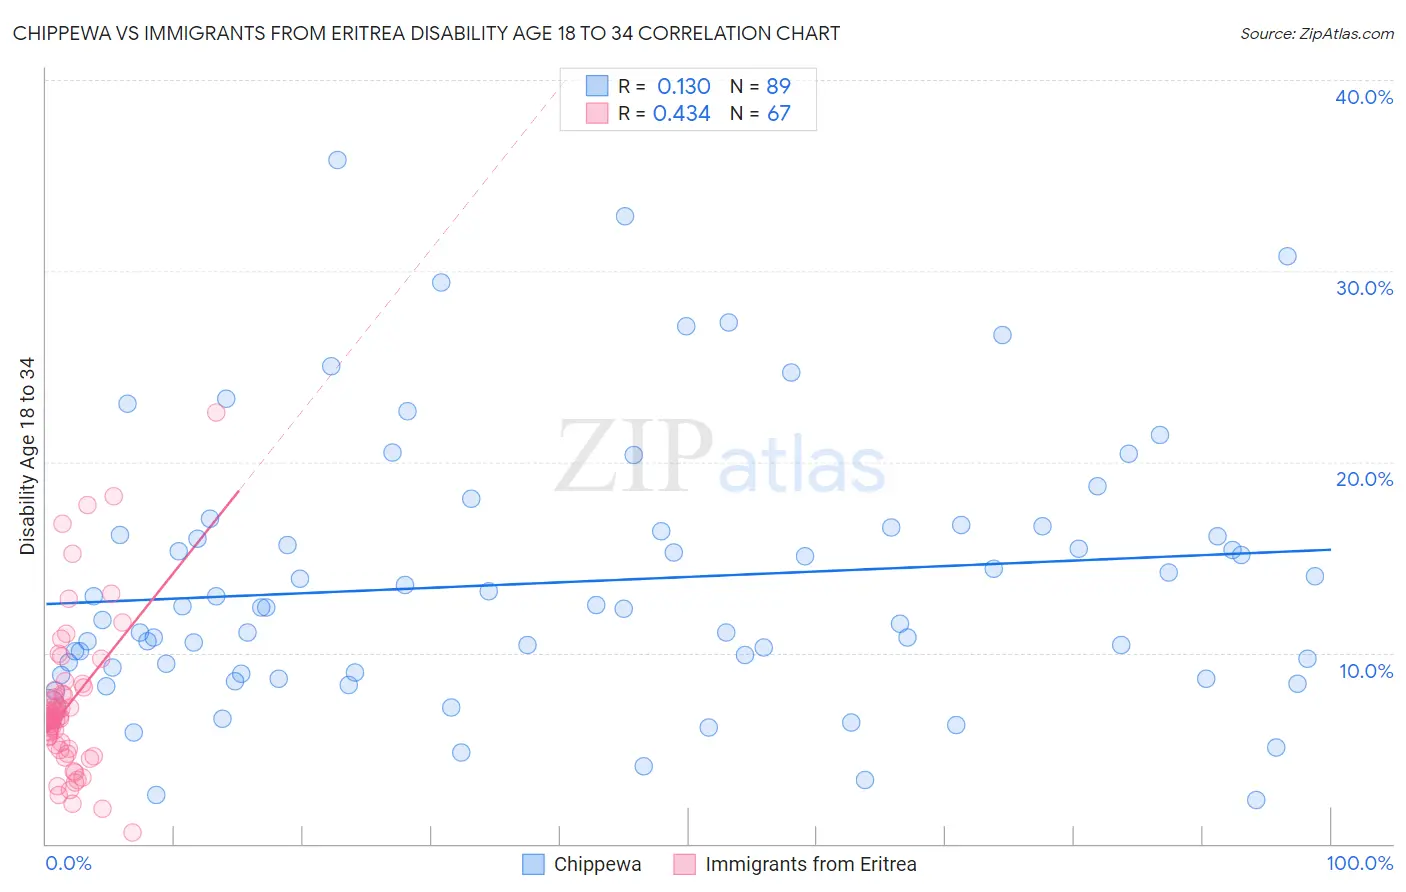
Chippewa vs Immigrants from Eritrea Disability Age 18 to 34 Correlation Chart
The statistical analysis conducted on geographies consisting of 214,650,505 people shows a poor positive correlation between the proportion of Chippewa and percentage of population with a disability between the ages 18 and 35 in the United States with a correlation coefficient (R) of 0.130 and weighted average of 9.0%. Similarly, the statistical analysis conducted on geographies consisting of 104,844,582 people shows a moderate positive correlation between the proportion of Immigrants from Eritrea and percentage of population with a disability between the ages 18 and 35 in the United States with a correlation coefficient (R) of 0.434 and weighted average of 6.5%, a difference of 39.0%.
Disability Age 18 to 34 Correlation Summary
| Measurement | Chippewa | Immigrants from Eritrea |
| Minimum | 2.3% | 0.58% |
| Maximum | 35.8% | 22.6% |
| Range | 33.5% | 22.0% |
| Mean | 13.7% | 7.3% |
| Median | 12.4% | 6.6% |
| Interquartile 25% (IQ1) | 9.0% | 5.0% |
| Interquartile 75% (IQ3) | 16.4% | 8.1% |
| Interquartile Range (IQR) | 7.5% | 3.1% |
| Standard Deviation (Sample) | 6.9% | 4.0% |
| Standard Deviation (Population) | 6.9% | 4.0% |
Similar Demographics by Disability Age 18 to 34
Demographics Similar to Chippewa by Disability Age 18 to 34
In terms of disability age 18 to 34, the demographic groups most similar to Chippewa are Yakama (9.0%, a difference of 0.010%), Chickasaw (9.0%, a difference of 0.060%), Choctaw (9.0%, a difference of 0.15%), Creek (9.0%, a difference of 0.38%), and Kiowa (8.8%, a difference of 1.6%).
| Demographics | Rating | Rank | Disability Age 18 to 34 |
| Apache | 0.0 /100 | #333 | Tragic 8.4% |
| Dutch West Indians | 0.0 /100 | #334 | Tragic 8.4% |
| Seminole | 0.0 /100 | #335 | Tragic 8.4% |
| Immigrants | Azores | 0.0 /100 | #336 | Tragic 8.5% |
| Ottawa | 0.0 /100 | #337 | Tragic 8.6% |
| Cherokee | 0.0 /100 | #338 | Tragic 8.7% |
| Kiowa | 0.0 /100 | #339 | Tragic 8.8% |
| Choctaw | 0.0 /100 | #340 | Tragic 9.0% |
| Chickasaw | 0.0 /100 | #341 | Tragic 9.0% |
| Yakama | 0.0 /100 | #342 | Tragic 9.0% |
| Chippewa | 0.0 /100 | #343 | Tragic 9.0% |
| Creek | 0.0 /100 | #344 | Tragic 9.0% |
| Alaskan Athabascans | 0.0 /100 | #345 | Tragic 9.4% |
| Houma | 0.0 /100 | #346 | Tragic 9.7% |
| Yuman | 0.0 /100 | #347 | Tragic 10.6% |
Demographics Similar to Immigrants from Eritrea by Disability Age 18 to 34
In terms of disability age 18 to 34, the demographic groups most similar to Immigrants from Eritrea are Immigrants from Central America (6.5%, a difference of 0.060%), Inupiat (6.5%, a difference of 0.070%), Bulgarian (6.5%, a difference of 0.090%), Immigrants from Panama (6.5%, a difference of 0.20%), and Immigrants from Sierra Leone (6.5%, a difference of 0.23%).
| Demographics | Rating | Rank | Disability Age 18 to 34 |
| Belizeans | 84.9 /100 | #146 | Excellent 6.4% |
| Immigrants | South Africa | 83.7 /100 | #147 | Excellent 6.4% |
| Immigrants | Belgium | 83.5 /100 | #148 | Excellent 6.4% |
| Hondurans | 83.1 /100 | #149 | Excellent 6.4% |
| Immigrants | Dominican Republic | 82.7 /100 | #150 | Excellent 6.4% |
| Tongans | 81.9 /100 | #151 | Excellent 6.4% |
| Bulgarians | 78.3 /100 | #152 | Good 6.5% |
| Immigrants | Eritrea | 77.4 /100 | #153 | Good 6.5% |
| Immigrants | Central America | 76.8 /100 | #154 | Good 6.5% |
| Inupiat | 76.7 /100 | #155 | Good 6.5% |
| Immigrants | Panama | 75.3 /100 | #156 | Good 6.5% |
| Immigrants | Sierra Leone | 75.0 /100 | #157 | Good 6.5% |
| Zimbabweans | 74.7 /100 | #158 | Good 6.5% |
| Dominicans | 73.6 /100 | #159 | Good 6.5% |
| Immigrants | Southern Europe | 72.5 /100 | #160 | Good 6.5% |