Chippewa vs Immigrants from Zimbabwe Median Male Earnings
COMPARE
Chippewa
Immigrants from Zimbabwe
Median Male Earnings
Median Male Earnings Comparison
Chippewa
Immigrants from Zimbabwe
$46,368
MEDIAN MALE EARNINGS
0.0/ 100
METRIC RATING
314th/ 347
METRIC RANK
$57,352
MEDIAN MALE EARNINGS
94.3/ 100
METRIC RATING
117th/ 347
METRIC RANK
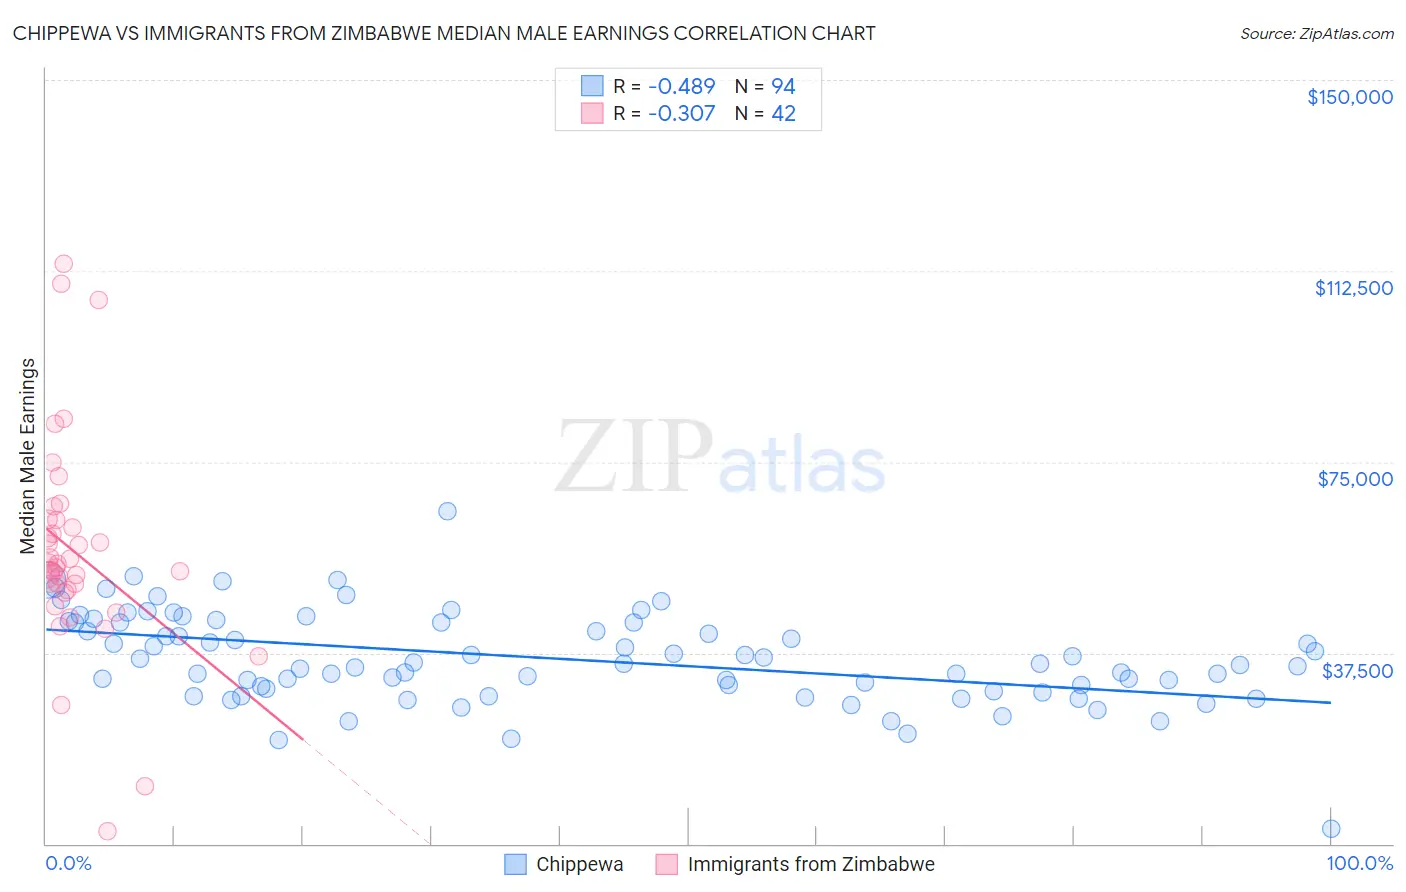
Chippewa vs Immigrants from Zimbabwe Median Male Earnings Correlation Chart
The statistical analysis conducted on geographies consisting of 215,007,267 people shows a moderate negative correlation between the proportion of Chippewa and median male earnings in the United States with a correlation coefficient (R) of -0.489 and weighted average of $46,368. Similarly, the statistical analysis conducted on geographies consisting of 117,801,711 people shows a mild negative correlation between the proportion of Immigrants from Zimbabwe and median male earnings in the United States with a correlation coefficient (R) of -0.307 and weighted average of $57,352, a difference of 23.7%.
Median Male Earnings Correlation Summary
| Measurement | Chippewa | Immigrants from Zimbabwe |
| Minimum | $3,000 | $2,499 |
| Maximum | $65,417 | $113,981 |
| Range | $62,417 | $111,482 |
| Mean | $36,432 | $57,395 |
| Median | $35,290 | $54,601 |
| Interquartile 25% (IQ1) | $30,344 | $49,751 |
| Interquartile 75% (IQ3) | $43,504 | $63,542 |
| Interquartile Range (IQR) | $13,160 | $13,791 |
| Standard Deviation (Sample) | $9,091 | $21,107 |
| Standard Deviation (Population) | $9,042 | $20,855 |
Similar Demographics by Median Male Earnings
Demographics Similar to Chippewa by Median Male Earnings
In terms of median male earnings, the demographic groups most similar to Chippewa are Honduran ($46,374, a difference of 0.010%), Hispanic or Latino ($46,419, a difference of 0.11%), Apache ($46,429, a difference of 0.13%), Immigrants from Guatemala ($46,244, a difference of 0.27%), and Immigrants from Caribbean ($46,193, a difference of 0.38%).
| Demographics | Rating | Rank | Median Male Earnings |
| Immigrants | Dominican Republic | 0.0 /100 | #307 | Tragic $46,655 |
| Ottawa | 0.0 /100 | #308 | Tragic $46,611 |
| Creek | 0.0 /100 | #309 | Tragic $46,594 |
| Cubans | 0.0 /100 | #310 | Tragic $46,580 |
| Apache | 0.0 /100 | #311 | Tragic $46,429 |
| Hispanics or Latinos | 0.0 /100 | #312 | Tragic $46,419 |
| Hondurans | 0.0 /100 | #313 | Tragic $46,374 |
| Chippewa | 0.0 /100 | #314 | Tragic $46,368 |
| Immigrants | Guatemala | 0.0 /100 | #315 | Tragic $46,244 |
| Immigrants | Caribbean | 0.0 /100 | #316 | Tragic $46,193 |
| Mexicans | 0.0 /100 | #317 | Tragic $46,147 |
| Cheyenne | 0.0 /100 | #318 | Tragic $46,062 |
| Haitians | 0.0 /100 | #319 | Tragic $45,903 |
| Immigrants | Honduras | 0.0 /100 | #320 | Tragic $45,787 |
| Fijians | 0.0 /100 | #321 | Tragic $45,607 |
Demographics Similar to Immigrants from Zimbabwe by Median Male Earnings
In terms of median male earnings, the demographic groups most similar to Immigrants from Zimbabwe are Hungarian ($57,309, a difference of 0.080%), Arab ($57,298, a difference of 0.090%), Lebanese ($57,409, a difference of 0.10%), Canadian ($57,286, a difference of 0.12%), and Swedish ($57,445, a difference of 0.16%).
| Demographics | Rating | Rank | Median Male Earnings |
| Palestinians | 96.2 /100 | #110 | Exceptional $57,778 |
| Europeans | 95.6 /100 | #111 | Exceptional $57,637 |
| Immigrants | Afghanistan | 95.4 /100 | #112 | Exceptional $57,582 |
| Carpatho Rusyns | 95.3 /100 | #113 | Exceptional $57,572 |
| Immigrants | Kuwait | 95.3 /100 | #114 | Exceptional $57,562 |
| Swedes | 94.8 /100 | #115 | Exceptional $57,445 |
| Lebanese | 94.6 /100 | #116 | Exceptional $57,409 |
| Immigrants | Zimbabwe | 94.3 /100 | #117 | Exceptional $57,352 |
| Hungarians | 94.0 /100 | #118 | Exceptional $57,309 |
| Arabs | 94.0 /100 | #119 | Exceptional $57,298 |
| Canadians | 93.9 /100 | #120 | Exceptional $57,286 |
| Immigrants | Albania | 93.3 /100 | #121 | Exceptional $57,179 |
| Immigrants | Jordan | 93.1 /100 | #122 | Exceptional $57,145 |
| Slovenes | 93.1 /100 | #123 | Exceptional $57,145 |
| Chileans | 91.9 /100 | #124 | Exceptional $56,973 |