Chippewa vs Immigrants from Sudan Median Male Earnings
COMPARE
Chippewa
Immigrants from Sudan
Median Male Earnings
Median Male Earnings Comparison
Chippewa
Immigrants from Sudan
$46,368
MEDIAN MALE EARNINGS
0.0/ 100
METRIC RATING
314th/ 347
METRIC RANK
$51,489
MEDIAN MALE EARNINGS
5.0/ 100
METRIC RATING
225th/ 347
METRIC RANK
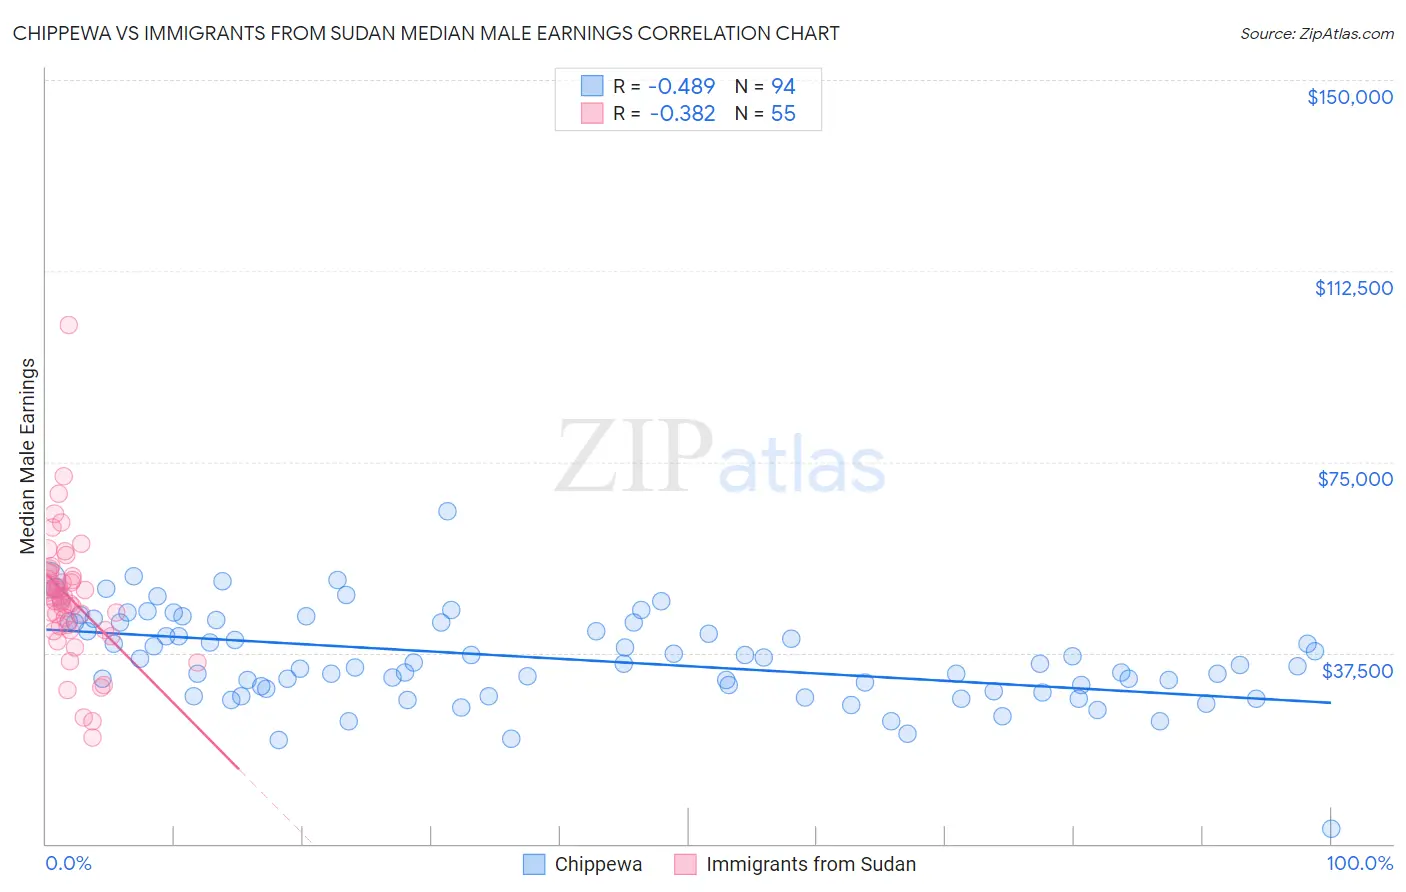
Chippewa vs Immigrants from Sudan Median Male Earnings Correlation Chart
The statistical analysis conducted on geographies consisting of 215,007,267 people shows a moderate negative correlation between the proportion of Chippewa and median male earnings in the United States with a correlation coefficient (R) of -0.489 and weighted average of $46,368. Similarly, the statistical analysis conducted on geographies consisting of 118,955,444 people shows a mild negative correlation between the proportion of Immigrants from Sudan and median male earnings in the United States with a correlation coefficient (R) of -0.382 and weighted average of $51,489, a difference of 11.0%.
Median Male Earnings Correlation Summary
| Measurement | Chippewa | Immigrants from Sudan |
| Minimum | $3,000 | $20,893 |
| Maximum | $65,417 | $101,789 |
| Range | $62,417 | $80,896 |
| Mean | $36,432 | $48,264 |
| Median | $35,290 | $48,306 |
| Interquartile 25% (IQ1) | $30,344 | $42,060 |
| Interquartile 75% (IQ3) | $43,504 | $53,241 |
| Interquartile Range (IQR) | $13,160 | $11,181 |
| Standard Deviation (Sample) | $9,091 | $12,693 |
| Standard Deviation (Population) | $9,042 | $12,577 |
Similar Demographics by Median Male Earnings
Demographics Similar to Chippewa by Median Male Earnings
In terms of median male earnings, the demographic groups most similar to Chippewa are Honduran ($46,374, a difference of 0.010%), Hispanic or Latino ($46,419, a difference of 0.11%), Apache ($46,429, a difference of 0.13%), Immigrants from Guatemala ($46,244, a difference of 0.27%), and Immigrants from Caribbean ($46,193, a difference of 0.38%).
| Demographics | Rating | Rank | Median Male Earnings |
| Immigrants | Dominican Republic | 0.0 /100 | #307 | Tragic $46,655 |
| Ottawa | 0.0 /100 | #308 | Tragic $46,611 |
| Creek | 0.0 /100 | #309 | Tragic $46,594 |
| Cubans | 0.0 /100 | #310 | Tragic $46,580 |
| Apache | 0.0 /100 | #311 | Tragic $46,429 |
| Hispanics or Latinos | 0.0 /100 | #312 | Tragic $46,419 |
| Hondurans | 0.0 /100 | #313 | Tragic $46,374 |
| Chippewa | 0.0 /100 | #314 | Tragic $46,368 |
| Immigrants | Guatemala | 0.0 /100 | #315 | Tragic $46,244 |
| Immigrants | Caribbean | 0.0 /100 | #316 | Tragic $46,193 |
| Mexicans | 0.0 /100 | #317 | Tragic $46,147 |
| Cheyenne | 0.0 /100 | #318 | Tragic $46,062 |
| Haitians | 0.0 /100 | #319 | Tragic $45,903 |
| Immigrants | Honduras | 0.0 /100 | #320 | Tragic $45,787 |
| Fijians | 0.0 /100 | #321 | Tragic $45,607 |
Demographics Similar to Immigrants from Sudan by Median Male Earnings
In terms of median male earnings, the demographic groups most similar to Immigrants from Sudan are Japanese ($51,473, a difference of 0.030%), Trinidadian and Tobagonian ($51,446, a difference of 0.080%), Samoan ($51,389, a difference of 0.19%), Immigrants from Cambodia ($51,594, a difference of 0.20%), and Ecuadorian ($51,596, a difference of 0.21%).
| Demographics | Rating | Rank | Median Male Earnings |
| Immigrants | Panama | 7.7 /100 | #218 | Tragic $51,962 |
| Immigrants | Ghana | 6.9 /100 | #219 | Tragic $51,836 |
| Immigrants | Armenia | 6.6 /100 | #220 | Tragic $51,793 |
| Immigrants | Senegal | 5.8 /100 | #221 | Tragic $51,647 |
| Immigrants | Bangladesh | 5.8 /100 | #222 | Tragic $51,642 |
| Ecuadorians | 5.5 /100 | #223 | Tragic $51,596 |
| Immigrants | Cambodia | 5.5 /100 | #224 | Tragic $51,594 |
| Immigrants | Sudan | 5.0 /100 | #225 | Tragic $51,489 |
| Japanese | 4.9 /100 | #226 | Tragic $51,473 |
| Trinidadians and Tobagonians | 4.8 /100 | #227 | Tragic $51,446 |
| Samoans | 4.6 /100 | #228 | Tragic $51,389 |
| Immigrants | Trinidad and Tobago | 4.5 /100 | #229 | Tragic $51,376 |
| Immigrants | Nigeria | 4.2 /100 | #230 | Tragic $51,310 |
| Barbadians | 3.9 /100 | #231 | Tragic $51,236 |
| Sudanese | 3.9 /100 | #232 | Tragic $51,216 |